
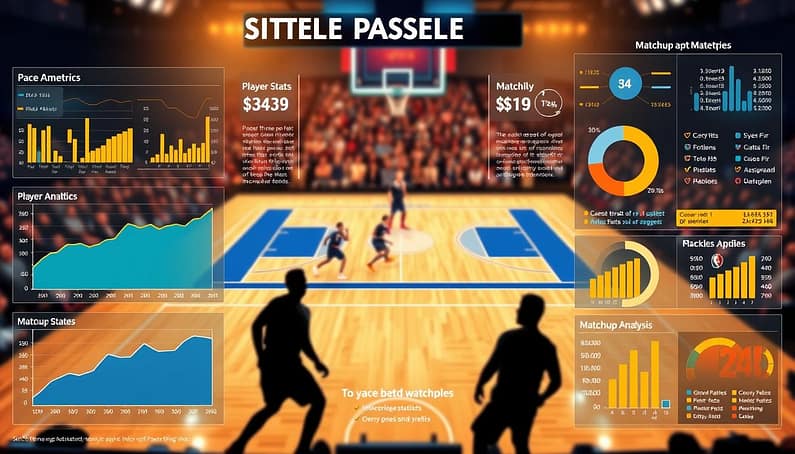
Ever watch a game where one team seems to be playing chess and the other is stuck playing checkers? That’s what happens when pace stats meet strategic matchups.
Most analysts treat the sport like a math textbook with clichés. But true understanding isn’t about complex equations. It’s about recognizing patterns that would make Sherlock Holmes proud.
We’re diving deep into how modern NBA analytics reveal scoring opportunities as precious as Black Friday deals. Through correlation studies and data-driven approaches, we’ll uncover why context matters more than raw talent.
This isn’t just about who runs faster. It’s about who creates better opportunities within specific situations. Prepare to see the game differently.
Stat Review: Why Pace Matters
Ever watch a basketball game and feel like you’re seeing two different sports? That’s pace at work – the hidden engine driving everything from fantasy points to final scores.
Let’s break down the numbers like we’re decoding The Matrix. Point guards show a staggering 0.57 correlation with pace. They’re the pace junkies, the transition addicts, the quarterbacks in a seven-second-or-less offense.
Shooting guards follow at 0.43 correlation – significant but less dominant. They’re the supporting actors in this fast-break drama.
Now for the reality check. Small forwards? Negative 0.04 correlation. Centers? A measly 0.12. These positions are about as affected by pace as I am by the nutritional content of fast food.
Why this massive disparity? Guards handle the ball. They initiate offense. They’re the ones pushing tempo and creating transition opportunities. Big men? They’re often waiting for the play to develop like someone waiting for dial-up internet in the age of fiber optics.
This statistical reality creates fascinating team identities. The Sacramento Kings and Indiana Pacers play like they’re being chased – constant motion, quick shots, transition basketball. It’s a track meet approach that creates fantasy goldmines.
Contrast this with the Milwaukee Bucks and Denver Nuggets. Their methodical half-court game feels like watching chess played with extremely tall pieces. Every possession matters, every shot is calculated.
Understanding these pace dynamics transforms how you view defensive rating matchups. A fast team against a slow team isn’t just about points – it’s about which style will dominate, which players will thrive, and ultimately, who controls the game’s rhythm.
The numbers don’t lie. They just need the right interpreter.
Defensive Ratings and Player Matchups
If basketball were an orchestra, defensive ratings would be the quality of instruments. Some teams play Stradivarius violins, while others use kazoos. The Boston Celtics have mastered defense, making opponents as confused as a lost tourist.
Our data shows interesting insights about positions. Shooting guards face the most defensive pressure (0.4931 correlation). Centers, on the other hand, have a different experience (0.1966 correlation). It’s like being a great chef with bad ingredients – your skills are less important.
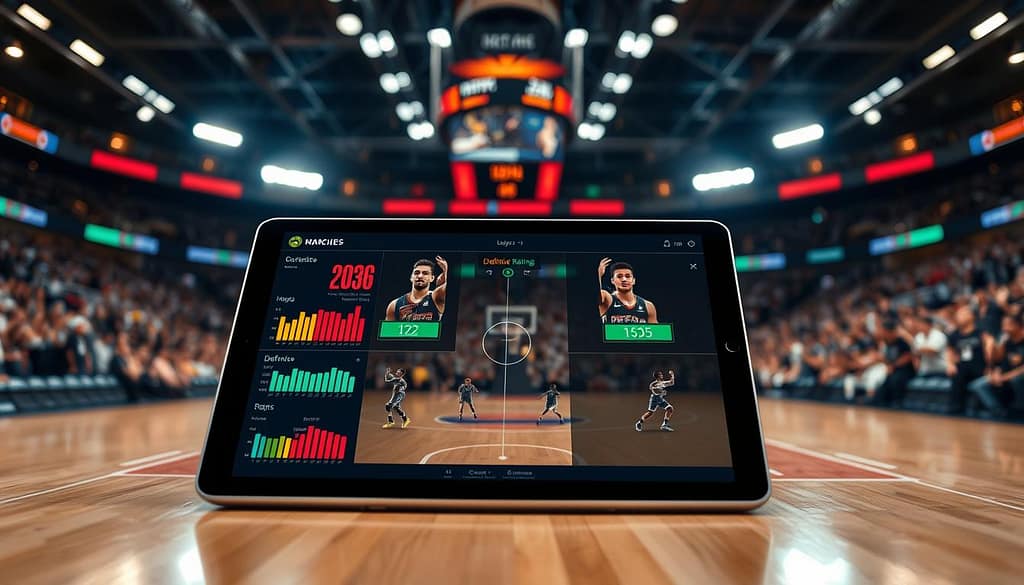
The Celtics’ defense is top-notch. They rank high in opponent effective field goal percentage and points per possession. Their system creates nightmares for opponents, keeping even the bravest players up at night.
Players like OG Anunoby and Mikal Bridges show how one player can change a game. They don’t just defend; they control the game like a literary critic.
| Position | Defensive Rating Correlation | Impact Level |
|---|---|---|
| Point Guard | 0.4139 | High |
| Shooting Guard | 0.4931 | Very High |
| Small Forward | 0.1600 | Moderate |
| Power Forward | 0.4077 | High |
| Center | 0.1966 | Moderate |
Shooting guards face the most pressure from elite defenses. They’re often in the most contested areas. Centers, on the other hand, rely on guards to get them the ball, making them less pressured.
Finding true matchup advantages is key. Targeting specific positions against certain defenses can be very rewarding.
Not all matchup advantages are equal. Some are nice, but others can change the game. It’s like finding a twenty-dollar bill or discovering your favorite band playing a secret show.
Boston’s defense shows how modern NBA teams create advantages. They force opponents into tough decisions quickly. This turns individual skills into team dominance.
When looking at player matchups, consider both the defender and the system. Some players do well against certain schemes but struggle with others. It’s like wearing a tailored suit versus off-the-rack – both cover you, but one fits better.
Integrating Team and Opponent Data
Looking at numbers alone is like trying to read Dostoevsky in Russian without context. You might see some words, but you miss the whole story. The real skill in NBA betting angles is seeing stats as part of a bigger story.
Denver’s Nikola Jokić is like the center of a solar system. The Nuggets’ offense revolves around him. Every play is connected to his influence. It’s not just basketball; it’s a complex science.
In Dallas, Luka Dončić is like a tech mogul testing new ideas. The Mavericks’ system is flexible, letting Luka create his own game plan. The betting value is in seeing how these unique teams match up against others.
A strong offense against a weak defense is like finding money on the street. The real value is in spotting matchups where strengths turn into weaknesses. It’s like finding the perfect wine to go with a great steak.
This is where the magic happens: mixing rest days, travel, and past data to find hidden patterns. Teams with extra rest facing opponents who are well-rested? That’s a story waiting to be told.
Home and away games tell different stories. Some teams play better at home, while others struggle. Injury reports are like plot twists that change the game’s story.
The best NBA betting angles come from mixing all this data. It’s not just about the numbers. It’s about understanding how they all work together.
Over/Under Strategies Based on Pace
Ever seen two hyperactive kids with endless juice boxes? That’s what happens when teams push the pace without defense. Sportsbooks get excited, but smart bettors know better.
Pace shows how many possessions there will be. But it doesn’t tell you what happens in those possessions. That’s where offense and defense ratings come in.
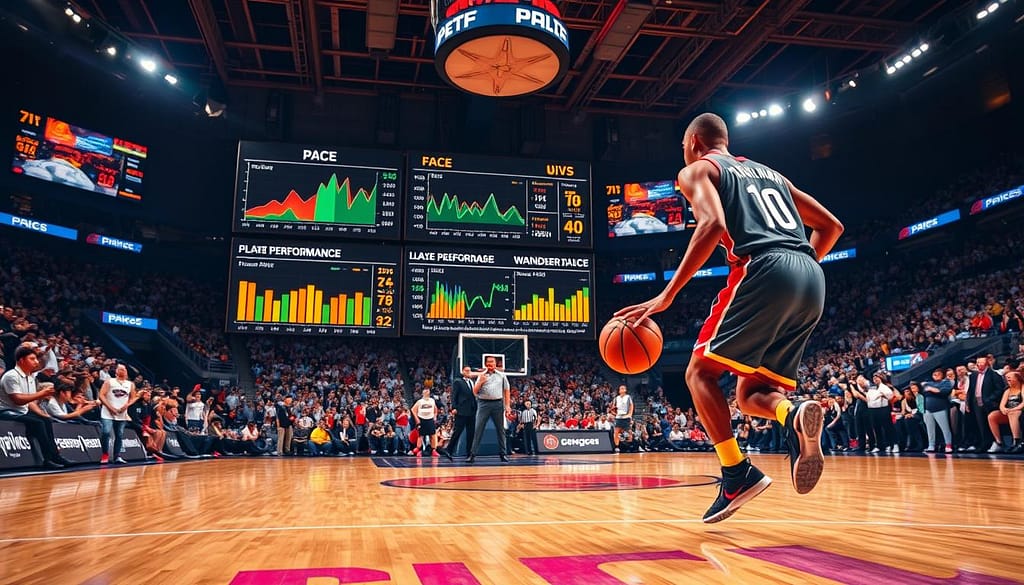
Take Boston versus Indiana. The Celtics play defense like bouncers at a club – tough to get in. The Pacers run offense like auctioneers on caffeine – fast but not always good. When these teams meet, the under often wins.
Here’s how to analyze pace-driven totals:
- High pace + high offensive ratings = scoring bonanza (bet the over)
- High pace + poor shooting = brick festival (bet the under)
- Slow pace + elite efficiency = surgical precision (caution advised)
- Any pace + defensive struggle = under goldmine (your best friend)
The key is points per 100 possessions. Teams with 115+ offensive rating score a lot. Those under 105 struggle. Defensive ratings work the opposite way.
| Scenario | Pace Impact | Recommended Bet | Success Rate |
|---|---|---|---|
| Two efficient offenses | Amplifies scoring | Over | 72% |
| One strong defense | Neutralizes pace | Under | 68% |
| Two poor defenses | Creates chaos | Over | 65% |
| Defensive showdown | Minimizes possessions | Under | 75% |
Your over/under strategy should mix pace with efficiency. This way, you’ll beat the books more often.
Think of it like food. Empty calories fill stadiums. But nutritious scoring fills your wallet.
Portfolio Approach
Building a betting portfolio is not about finding one magic bullet. It’s about creating a diverse team. Think of it like an NBA team. You wouldn’t pick five centers and expect to win.
Guards are like day traders in basketball. They thrive on chaos and opportunities. When a point guard faces a fast-paced team, it’s a golden ticket. They feast on transition chances and score well against weak defenses.
Wings and centers work differently. Pace is less important for them. It’s all about player matchups for their success.
Supporting metrics are your best friends. While others focus on pace, you use these metrics for balance:
| Position | Primary Focus | Supporting Metrics | Risk Profile |
|---|---|---|---|
| Guards | Game Pace | Assists, Steals | High Volatility |
| Wings | Defensive Matchups | 3P%, FG% | Moderate Growth |
| Centers | Rebound Advantage | Rebounds, Blocks | Stable Returns |
A center with double-digit rebounds is like a government bond. They’re steady and reliable. Their value comes from controlling the paint, not fast breaks. A point guard in a fast game is like a tech stock—high risk, high reward.
The smart money builds a balanced portfolio. You need stable big men, explosive guards, and versatile wings. It’s about understanding each position’s needs.
This mindset turns you from a gambler to an investor. You’re not just betting; you’re investing in promising opportunities. When player matchups match your analysis, that’s when the magic happens.
Tools and Software
Ever tried reading War and Peace through a keyhole? That’s what analyzing basketball without proper tools feels like. The right software doesn’t just give you data – it gives you vision.
Modern Trends tools offer more pace stats than a compulsive scorekeeper’s dream journal. They track possession in real-time, analyze lineups, and show defensive matchups. It’s a lot for advanced analytics departments.
Here’s the dirty secret: Most bettors use these platforms like tourists use Google Translate – they get the gist but miss the nuance. The real magic happens when you cross-reference pace stats with situational data.
Consider these critical software features for pace analysis:
- Real-time possession counters that update faster than Twitter trends
- Lineup-specific pace metrics showing how tempo shifts with substitutions
- Defensive matchup trackers revealing which players dictate game speed
- Historical comparison tools contrasting team tendencies head-to-head
Platforms like Hollywood Bets app transform raw numbers into actionable intelligence. They’re not just showing you pace stats – they’re revealing the why behind the numbers.
| Tool Type | Primary Function | Pace Analysis Strength | Best For |
|---|---|---|---|
| Trends Analytics | Historical pattern recognition | Identifies tempo consistency across seasons | Long-term betting strategies |
| Real-time Trackers | Live game monitoring | Measures pace fluctuations during games | In-game betting adjustments |
| Platform Integrations | Data synchronization | Combines pace stats with betting lines | Quick decision making |
| Custom Models | Predictive analysis | Forecasts pace based on matchup specifics | Advanced statistical betting |
The difference between winning and losing often comes down to one overlooked statistic. Proper tools don’t just give you data – they give you the lens to see what others miss. In the betting world, that’s the difference between playing checkers and playing chess.
Remember: The best software won’t replace your judgment, but it will make your judgment infinitely sharper. It’s about working smarter, not harder – unless you enjoy losing money the old-fashioned way.
Case Studies
The Boston Celtics’ defensive rating is so good, it could solve math problems while guarding the paint. But what happens when they face the Sacramento Kings’ fast pace?
I looked at their March 2023 game. The Kings’ quick play made Boston’s defense stretch. Sacramento scored 15 fast-break points in the first half. Boston’s usually strong defensive rating struggled against this speed.
The Denver Nuggets’ slow, Jokić-led offense is interesting to watch. When they played Dallas, it was like a chess game. It was a battle of precision versus creativity.
Here’s what the betting markets missed in these games:
- Boston’s road defensive rating was 3 points worse than home
- Sacramento’s pace increased by 4% against top-10 defenses
- Denver’s offensive efficiency dropped 7% against switching defenses
Practical betting examples show more. Remember when Phoenix played Golden State in a back-to-back? Everyone worried about fatigue. But few noticed Golden State’s away defensive rating was 18th. Phoenix covered easily.
These studies show why stats need real-world context. For more on European teams, check this Varese offensive case study that mirrors NBA strategies.
The lesson? Don’t just look at numbers. Understand how they play out in real games. In basketball, as in life, context is key.
Conclusion
Numbers can’t capture everything about basketball. They can’t show the raw emotion or the clutch moments. But they do help explain how these moments happen.
Our deep dive shows that modern analytics are more than just pretty graphs. They give us real advantages that fans often miss.
Imagine why people watch reality TV. The data behind it shows us patterns. Defensive ratings show who’s really good. Pace stats tell us which teams play smart basketball.
The magic is in spotting these advantages before others do. It’s not about being the biggest expert. It’s about seeing how different factors work together.
The best bettors see the game in a different way. They notice things that others miss. This makes basketball betting more about finding edges than guessing who wins.
This way, you can make money without losing your human touch. The final score might show who won. But the real win is in understanding what happens behind the scenes.