

Let’s start with a confession. The main line is a consensus hallucination. It’s the smoothed, sanitized house view designed for mass consumption.
But the real action, the intellectual juice, flows in the tails. This is the world of alt spreads and derivatives. Think of them as the market’s whispered bets on asteroid strikes and black swan events.
Forget simple gambling. This is forensic analysis. These instruments are distinct assets that convey forward-looking information. They form a parallel pricing universe.
Why do they exist? To transfer risk and price our collective anxiety and greed. The “log investor” perspective gives us a benchmark. It helps extract what the market truly expects, not just what it politely states.
Understanding this isn’t about predicting the future. It’s about decoding the present’s hidden narratives. The fat middle of the bell curve is boring. The mispricings—and the real opportunities—live out in the distribution tails.
So, are you ready to look beyond the consensus? The alt spreads and totals are waiting.
Why tails get mispriced (skew, key numbers, low limits)
If financial models were weather forecasts, they’d predict gentle breezes while ignoring the hurricanes lurking in the distribution tails. The normal distribution, that elegant bell curve we all learned in Stats 101, collapses under the weight of real-world chaos. It assumes a smooth, predictable world. Reality delivers jumps, crashes, and “lumpy information” like a surprise FOMC announcement.
This isn’t just academic. The 2008 financial crisis and the 2020 market plunge are textbook examples of leptokurtosis—a fancy word for fat tails. These events live way out on the fringes, in the land of four and five standard deviations. According to the old lognormal models, they were near-impossible. Yet they keep happening.
So why does the market consistently get these extreme outcomes wrong? Let’s diagnose the three core pathologies.
First, the Skew. The market fears crashes more than it dreams of rallies. This isn’t irrational finance; it’s collective trauma. The psychic scars of Black Monday and 2008 mean investors overpay for left-tail protection. It’s a fear premium baked into the price, creating a persistent asymmetry. The right tail, the miraculous rally, often goes under-priced. The model says “symmetry.” The human heart says “protect me from the abyss.”
Second, Key Numbers. People don’t think in smooth probability distributions. We think in stories clustered around milestones. In sports, it’s a round team total. In markets, it’s a psychological level like Dow 40,000. These numbers act as narrative magnets, distorting where probability weight accumulates. Bookmakers know this. They shade lines toward these magnets, creating pockets of mispricing just off the round number. The crowd bets the story, not the math.
Third, Low Limits. This is the structural kicker. Even when sharp money identifies these tail mispricings, there’s often a cap on how much they can bet. It’s the financial equivalent of trying to drain the ocean with a teacup. The “vig” or margin on these exotic bets is high, and the limits are low, preventing efficient arbitrage. The smart money can’t fully correct the stupidity. So the mispricing persists, a stubborn inefficiency in the far reaches of the distribution tails.
The core error is confusing risk-neutral expectations (what the options market implies) with true expectations (what actually happens). Models like Black-Scholes live in the risk-neutral world. They’re useful fictions. But in the real world, information arrives in lumps, prices gap, and distribution tails are fatter than any textbook allows. Recognizing this gap isn’t just intellectual. It’s where the edge lies.
Building distributions: from model to alt prices
Going from spotting mispriced tails to building a market view is a big leap. We’ve found the problems—skew, key numbers, low limits. Now, we need to figure out the cause: the market’s full forecast.
We start with the messy alt line prices. Our guide is the risk-neutral probability density function (PDF). It’s like taking broken slang pieces and making a complete language. It shows what the market implies should happen, with all its fears and doubts.
So, how do we make it? We use simple to complex tools.
- Black’s Model (The Stick Figure): This is a basic approach. It assumes a simple, symmetrical world. It’s like drawing a person with a circle and five lines. But it misses the real-world messiness.
- Mixture of Lognormals (The Master Sculptor): This is often the best choice. It combines different distributions to capture the market’s true shape. It handles the oddities and long tails we see in sports betting.
- Hermite Polynomial Expansion (The Robust Engineer): This is a reliable, mathematical method. It’s about fixing a standard model to fit the real world. It’s precise without being too complicated.
This process is not just theory. It’s the engine behind SGP pricing models. When you stack player props with team totals, it’s not guessing. It’s using a built PDF to understand how they connect.
We’re not just looking at numbers anymore. We’ve turned the market’s talk into a full story of the game. With this story, we can ask: does the price match the story?
Comparing SGP builder prices vs implied fair odds
Opening your sportsbook’s SGP builder is like checking the weather forecast and finding a bad restaurant menu. Your implied fair odds are beautiful, but the book’s prices are harsh. This is where how to win at sports betting gets real and often unfair.
Your fair odds come from the alt market. You’ve made a risk-neutral PDF—a perfect, yet fictional, view of all game outcomes. It shows the “clean” probability of Player X scoring 30+ and Team Y winning by 6+.
Then, look at the SGP builder. Its prices aren’t based on a real distribution. It’s a mix of different parts, like a monster. The legs are main-line risk, the arms are old software, and the head is all about making money.
The difference can be huge. Your model might say there’s a 20% chance (fair odds +400). But the SGP builder might offer +1200. Is that a good deal or a trap?
You need a plan. Ask two questions. First, does the builder ignore a key correlation the alt market sees? If your alts show a player going wild is linked to a big team win, but the builder doesn’t see it, you might have an edge.
Second, is the book’s pricing just lazy? Sometimes, their algorithm adds a big vig to each leg and multiplies it. Your alt-derived distribution can spot when this creates a mispriced bundle.
When is it a steal? When the builder’s price is longer than your fair odds, and it’s not just fantasy. When is it a sucker bet? When the price looks good but your distribution says it’s almost impossible.
This is the art of finding the cognitive mismatch. The market whispers a complex story through derivatives markets. The sportsbook sometimes just shrugs. Your job is to listen to the whisper, ignore the shrug, and bet only when the price is right.
Ladder Strategies (Staggered Alts) and Partial Hedging Logic
Sophisticated bettors don’t just attack a mispriced tail; they lay siege to it with a calculated, staggered approach. Going all-in on one extreme alt is like putting your entire net worth on red 32. It’s thrilling, cinematic, and profoundly dumb. The smarter play? Laddering.
Think of laddering as buying a narrative, not just a number. You’ve identified a mispriced outcome—say, a player scoring way over their line. Instead of hammering the +400 for 40+ points, you build a ladder. You take the +150 for 30+, the +300 for 35+, and the +800 for 40+. You’re stacking related alts at progressively more extreme outcomes.
This creates a payoff structure that mirrors a call option spread in finance. You finance the cheaper, more likely leg by risking profit on the juicier, longer shot. Your risk is defined. Your exposure is managed across the entire spectrum of the “blowout” narrative. It’s tail risk parity, adapted for a single game.

Now, let’s add a layer of nuance that separates the analysts from the amateurs: partial hedges. Why would you ever hedge a bet you believe in? For the same reason you buy home insurance but don’t live in a bunker. It’s about protecting against a specific, catastrophic risk without completely capping your upside.
Partial hedging logic is about balancing exposures. Imagine your ladder is built on a quarterback throwing for 300+ yards. You’re heavily exposed to him having a big day. A partial hedge might involve a small, opposite position on a main-line bet, like taking the Under on his passing yards at a standard line. If he completely flops, your hedge pays. If he goes nuclear, your ladder pays big, and the hedge is a small cost of doing business.
You can also use one alt to hedge another. Perhaps you have a ladder on a team winning by 10+ points. You could take a tiny slice of the opposing team’s moneyline as a hedge against a last-second backdoor cover. This isn’t about being scared. It’s about engineering your risk/reward profile.
The goal is to create scenarios where you lock in profit. Maybe your 30+ point leg hits, guaranteeing a win, while your 40+ leg stays alive for a bonus. Or your main bet wins, and your partial hedge on the alt becomes a negligible loss. This customized approach is what pure, one-and-done betting can never achieve.
In essence, laddering and partial hedges turn betting from a series of isolated explosions into a coordinated campaign. You’re not just picking winners. You’re architecting your book’s exposure, one strategically staggered alt at a time.
Creating middles with alts without overpaying vig
Imagine making a bet that wins from a range of outcomes. This is called the “middle.” It’s like finding money on the street, but instead, it’s in the world of sports betting.
In a perfect world, arbitrage would be simple. But we have vig, which is like a toll on the road to free money. It’s the cost of making a bet.
Finding middles used to mean looking for price differences between sportsbooks. It was like a treasure hunt. Alt lines change the game entirely. They let you mix different bets to create new ones.
The goal is to find a range where both bets win. It’s not about a specific score. It’s about a range where both bets are good.
This is like financial engineering with sports. You mix two bets to make one good one. The key is to avoid too much vig.
Let’s look at an example. Say you bet on Team A -3.5 and Team B +10.5. You’re not betting on a big win or a close game. You’re betting on a score between 4 and 10 points.
The vig on each bet is a small cost. But the payout from the middle can be big. Many people get too excited and forget about the vig.
You need to figure out the total probability. Use the odds from each alt spread and alt total. If your middle has a higher chance of winning than the prices suggest, you have an edge.
This is advanced. It’s like using alt lines as building blocks. You combine them to make a bet on market mistakes. The different prices in the alt market help you find these mistakes.
Don’t look for just one bet to win. Look for a range where the market is wrong. That’s how you make middles with alt spreads and totals without losing to vig. It’s not just betting. It’s a smart way to take advantage of market flaws.
When not to play alts: blowout risk, garbage time, pull rates
There’s a fine line between making a smart bet and losing money. The best bettors know when to walk away. This section is your wake-up call, showing you the flaws in your models.
Three things can ruin your alt line bet: blowout risk, garbage time, and pull rates. Each one changes the game’s story. Your model might be perfect for your plan, but sports often surprise you.
Blowout risk isn’t just a team losing. It’s when your bet’s game script falls apart. Say you bet on a running back’s yards. Your analysis predicts a run-heavy game. But, by the second quarter, the team is down big, and the run stops. Your chance of winning plummets.
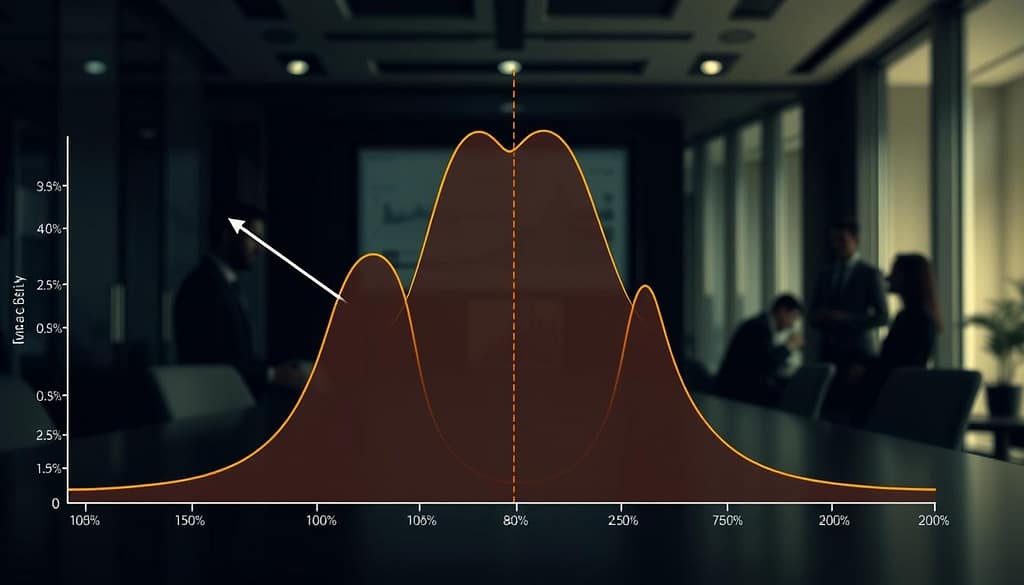
Garbage time is another problem. It’s when starters leave and backups play, messing up your analysis. A quarterback padding stats in the fourth quarter of a big game doesn’t show his true skill. This period can make a blowout seem closer or inflate stats, distorting your analysis.
The pull rate is the final blow. It’s when coaches bench stars, cutting off possible outcomes. It’s like a surprise announcement in finance. Before the announcement, everyone is unsure. During, the market settles. After, it erupts again as people digest the news.
In sports, the final whistle is like the announcement. The decision to bench a star is a mini-event. The uncertainty peaks before the benching, settles when it happens, and then spikes again as you wonder about the backups. Your bet on the star is over the moment he’s benched. The chance you were counting on is gone.
So, when do you stop betting? When there’s a big mismatch, leading to a blowout. When it’s late in the season and a team has nothing to play for. When a star player is on a minutes limit or in a back-to-back scenario, making a pull event likely.
Wisdom in alt line betting is knowing not every statistical edge is real. Some are just illusions, waiting to be broken by real-world surprises. Your model is a guide, but the game is unpredictable, and it can change suddenly.
Tracking tail EV and variance impact
One win in a tail bet means nothing. It’s just a brief moment, a statistical illusion. The real edge comes from winning consistently by finding mispriced chances across many outcomes.
You need to track two key things: your Expected Value and the impact of variance. That big win on a long-shot touchdown might have a 90% chance of a small loss. Is it worth it for your portfolio? The Merton formula shows how risk premium relates to variance. You must measure this volatility.
Study the risk-neutral probability density function. Look at more than just the mean. Check skew and kurtosis to find real mispricings, like in complex SGP pricing.
Keep track of your alt bets separately. See how they mix with your other bets. Do they spread out your risk or make it more focused? This turns you from a lucky gambler into a strategic player. You’re not just chasing wins. You’re managing a portfolio of high-risk bets.
Being a risk manager requires discipline. Adjust your bets based on the risk they add. Knowing SGP pricing is just the start. Understanding its effect on your risk is the end.
The wise person knows where to bet and how much to risk. It’s not just about finding the edge. It’s about managing your risk wisely.