
Welcome to the casino’s version of day trading. The ticker tape is a live sports feed. Your portfolio swings with every pitch and possession.
This is microbetting: wagering on hyper-specific, in-game events. It evolved from clunky tablets in 2010 to today’s machine-learning algorithms. The sportsbook’s dream is to turn you into a human API, constantly firing wagers into their system.
Why the push? It’s a simple, brutal math game. More volume means more frequent application of the house edge. For the book, it’s a grind. For you, it’s a lattice of momentary market inefficiencies.
The key to navigating this noise is the live win probability model. Think of it as your Bloomberg Terminal for the ballgame. This dynamic tool, supported by academic research on in-play odds, calculates the true price of every fleeting second.
For the savvy, this isn’t just a pit of vig. It’s a field ripe for the analytically minded. The live win probability transforms chaos into a readable signal.
Market structure: feeds, holds, and delays
Market structure in live trading is complex. It includes the feed, the hold, and the delay. Knowing this can make you a better trader. It’s all about understanding the digital exchange floor.
The feed is essential. It’s not just a simple ticker tape. It’s a stream of real-time data, covering every detail of the game. Companies like Huddle use algorithms to make sense of this data, turning it into clear signals for traders.
Kero Sports focuses on the market state engine. It listens to Huddle’s data and quickly updates the market. A player injury, for example, changes the odds of many bets instantly.

State transitions are key. A simple change in the game can shift the market. The feed must update quickly to reflect these changes. Any delay can lead to lost opportunities.
Latency is a major issue. Information travels fast, but not fast enough for trading. The goal is to update the market in under 0.5 seconds. Slower than that, and you’re at a disadvantage.
The hold is another challenge. It’s the margin that bookmakers and exchanges take. It’s like a hidden tax on every bet. A small hold is good, but a large one can eat into your profits.
The technical challenge is to make the system fast and user-friendly. The data must be processed quickly, but the interface should be easy to use. This balance is what makes in-play trading possible.
To trade in-play, start by learning about the infrastructure. The feed, the hold, and the delay are all important. Mastering these can turn you from a spectator to a trader who makes the most of every moment.
State Variables That Matter by Sport
The real money is made in the silent moments, like a 3-2 count or a 2nd and goal. The score is just the beginning. The real story is in the detailed, changing state variables of the game.
A sport is not just one event. It’s a series of key moments, each with its own value. Knowing which moments are most important is key.
In American football, the key is down and distance. A 1st & 10 at midfield is very different from a 3rd & 1 at the goal line. Advanced models look at the expected value of each situation, not just who wins.
For example, a 2nd & Goal from the 5-yard line has a clear win probability. This is something sharp bettors can use to their advantage.
Baseball is all about the plate appearance. But not all PAs are the same. Betting on a pitch in a 0-0 count in the 3rd inning is easy. But betting on a pitch with the bases loaded in the 9th is much more intense.
The count, the outs, and the base runners all play a big role. They create big opportunities for betting.
Basketball is all about possessions. The “next possession” market is very interesting. It simplifies the game into a single question: will this possession end in points?
The win probability can change a lot after a score or a stop. This makes basketball perfect for in-play trading.
Companies like Sportradar have found that micro markets can tap into these moments. They’re not betting on the game; they’re betting on the small parts that make up the game. Sports like football, baseball, and basketball are best for this because they have lots of action and natural breaks.
So, how do you rank these moments? You need a guide. Here’s a cheat sheet:
| Sport | Key State Variable | High-Leverage Example | Why It Moves the Needle |
|---|---|---|---|
| American Football | Down & Distance | 4th & 1 in OT | Binary, game-on-the-line outcome with huge WP swing. |
| Baseball | Count & Base Occupancy | Bases loaded, 3-2 count, bottom 9th | Maximum pressure on pitcher/batter; run expectancy peaks. |
| Basketball | Possession & Game Clock | Last possession, tie game | Single event decides the entire contest. |
| Tennis | Serve & Point Score | Break point down | Shift in service game control alters match momentum. |
Timeouts are also key. A timeout is not just for commercials. It’s a chance to reset the game. It stops momentum, lets players rest, and changes the game state.
It’s like chess. You look at the players and the game state, not just the board. The “board” is the game itself, with its own rules and moments.
Mastering this is the first step to building a model that doesn’t just react to the scoreboard. It reacts to the game’s story. Once you can read that, you’re not betting on sports. You’re trading in probability.
Building/using a live WP model; anchoring vs true price
Your biggest enemy in live trading isn’t the sportsbook’s algorithm. It’s the story you tell yourself about what ‘should’ happen next. Building a live win probability (WP) model is like using data to fight that narrative. It’s not about having a crystal ball. It’s about having a better, faster, stronger spreadsheet than the other guy.
Forget the sci-fi hype of true AI. Today’s dynamic odds are driven by machine-learning models. Companies like SimpleBet have mastered this. They use lots of data to update probabilities quickly. It’s all about computational power, not consciousness.
The key to building your own edge is clean, fast data. You must weigh the variables correctly. For example, is a turnover in the red zone more impactful than a missed free throw? Your framework must update in real-time and be useful for making decisions.
A model that says “Team A now has a 67.3% win probability” is just for fun. But a model that flags when that probability jumps to 80% while the sportsbook’s odds imply 65% is a trading signal.
This is where the human element is non-negotiable. The algorithm doesn’t understand a quarterback playing through a hidden injury or the psychological weight of a rivalry game. You do. This nuance is your moat. The modern market also craves instant gratification. The rise of microsettlements—cashing out bets on single plays—means your model needs to evaluate not just the game’s final outcome, but the next five minutes of clock time.
As firms like ParlayBay note, oddsmakers now must react almost instantly to in-game events. A missed call, a surprise substitution, a gust of wind. The window for value closes in seconds. Your model must be built for this speed.
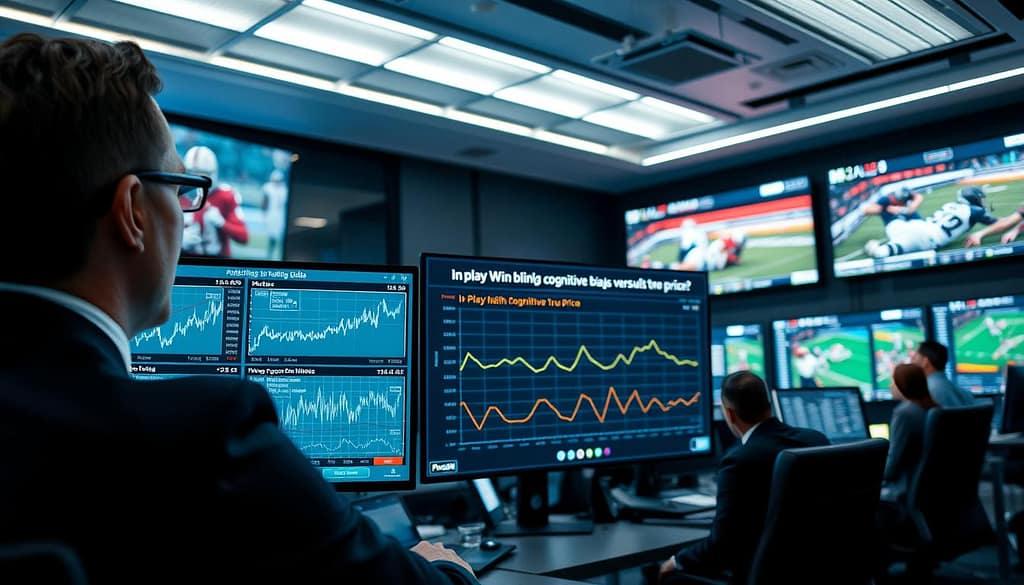
All this technical work, though, can be undone by a ancient glitch in the human hardware: anchoring. This is the intellectual trap. Are you evaluating the true price of a bet, or are you hopelessly anchored to the pre-game line, the current score, or your pre-existing belief about the teams?
Think of it this way. Your team was a 7-point favorite. They’re now down by 10 in the third quarter. Your brain is anchored to that -7 line. “They’re supposed to be winning!” This emotional narrative clashes with the cold math. The sportsbook’s machine-learning model has the emotional range of a toaster. It doesn’t care what was supposed to happen. It recalculates based on the new, unambiguous fact of a 17-point swing. Your sentimental attachment is its profit source.
The sharpest edge in live trading is found precisely in this gap. It’s the chasm between the anchored public perception and the algorithm’s merciless true price. When the crowd is panicking because the favorite is down (anchored to the past), the model may already see a path to victory based on possession trends and timeouts remaining. That discrepancy is where value lives.
Ultimately, in-play trading is a constant battle. Not just between teams, but between narrative and number. Your live WP model arms you with the numbers. Your self-awareness about anchoring prevents you from being disarmed by the story.
Entry windows: timeouts, reviews, injuries, end‑game fouls
So, you’ve built your model and know the market’s quirks. You’ve figured out which state variables are key. Now, the big question is: when do you enter?
You’re after the meaningful stops, not just any. These are the entry windows where things get crazy. Imagine a coach’s challenge or a star quarterback’s injury that hasn’t been priced in yet.
Think about a basketball game’s final minute with a deliberate foul. It changes the game’s pace to a stop-and-go rhythm. Here, historical data won’t help. It’s a chance for a trader with game sense to spot a price gap.
Kero Sports bases its microbetting on this idea: giving “real-time, highly relevant options” to avoid endless scrolling. It’s all about quick wins. These markets pop up and disappear fast, just like the tactical windows in sports.
The aim is simple: find order in the chaos. Or better yet, make money from the confusion before others catch on.