
Let’s explore the hidden engine room of every bet you make. It’s not just theory; it’s the invisible architecture that decides if your bet goes unnoticed or costs you a lot.
Imagine a calm, deep lake versus a choppy, shallow pond. In the calm lake, you move easily. But in the shallow pond, you struggle before you even start.
We’re talking about the plumbing—the bid-ask spreads that quietly take your money, the hidden walls of market depth, and the elusive concept of liquidity.
Why is liquidity important? It’s the key to smooth execution. Thin order books and wide spreads can kill your profits. But, big players often hide their true plans, making it seem like there’s more liquidity than there is.
The real magic is in the timing. By analyzing over 50,000 minutes of data, we find strong temporal patterns. Even something simple like the time of day can change how much liquidity is available by 42%. This is how you find time-of-day edges.
Knowing this isn’t just for experts. It’s the first step in learning when to go with the flow and when to stay out of trouble.
Who sets lines and who copies: a quick map
The first price isn’t random. It’s a smart move by a market maker who has a lot at stake. Imagine a high-stakes poker game, but with data packets instead of chips.
On one side, you have the smart ones. These are the market makers and sharp books. They don’t just guess. They provide liquidity and manage risks. They use big data to set the first price.
But being first comes with a cost. It’s the spread. This is their fee for making the market. It’s like a toll for crossing their bridge.
Then, there are the big players. Think hedge funds or betting syndicates. They move markets with their money. They hide their bets to avoid front-running and slippage.
This creates a cool contrast: visible vs. hidden intent. The line you see is just the start. Big “hidden” orders shape the real market.
On the other side, you have the copiers. These are the rec books. They can’t afford the models or risk to set prices. So, they follow the smart books. When a market maker posts a line, they adjust it slightly to attract opposite bets.
This is like a game of telephone. The first signal gets changed with each copy. A sharp book sets the NBA total at 215.5. A rec book copies it at 216.0 to attract under bets. Another adjusts it to 216.5. The changes spread.
Let’s clearly show who’s who and what drives them.
| Role | Primary Motivation | Order Visibility | Typical Action |
|---|---|---|---|
| Market Makers / Sharp Books | Provide liquidity, earn the spread, model edge | Mostly visible (open orders) | Set the opener, adjust based on sophisticated models |
| Large Institutions (Syndicates, Funds) | Execute large bets with minimal price impact | Mix of visible and hidden | Drip-feed orders, use dark pools of liquidity |
| Recreational Books (Rec Books) | Balance book, minimize risk, follow volume | Visible (reactive) | Copy and shade existing lines, chase public money |
It’s not just about being smart. Sometimes, being first is a trick. A market maker might post a line they know is soft. They expect sharp money to hit it, so they can adjust and make money on the move. It’s a cycle of liquidity, not a search for truth.
So, when you see a line, think: Is this the original, or just an echo? The map isn’t just territory; it’s a guide to money and information flow. Knowing who drew the map tells you more than the map itself.
Limits and liquidity cycles by sport and day
Imagine a marketplace that changes like a city square at noon and a ghost town at midnight. This is the sports betting world every day. It’s a financial rhythm that we ignore at our own risk.
Our data shows a big difference in the betting market. It’s full of life at 11:00 UTC but empty by 21:00 UTC.
This change follows the world’s waking hours. London’s morning coffee time brings a surge in liquidity. New York’s lunch break makes the market sleepy. Asia’s sleep time makes it flat.
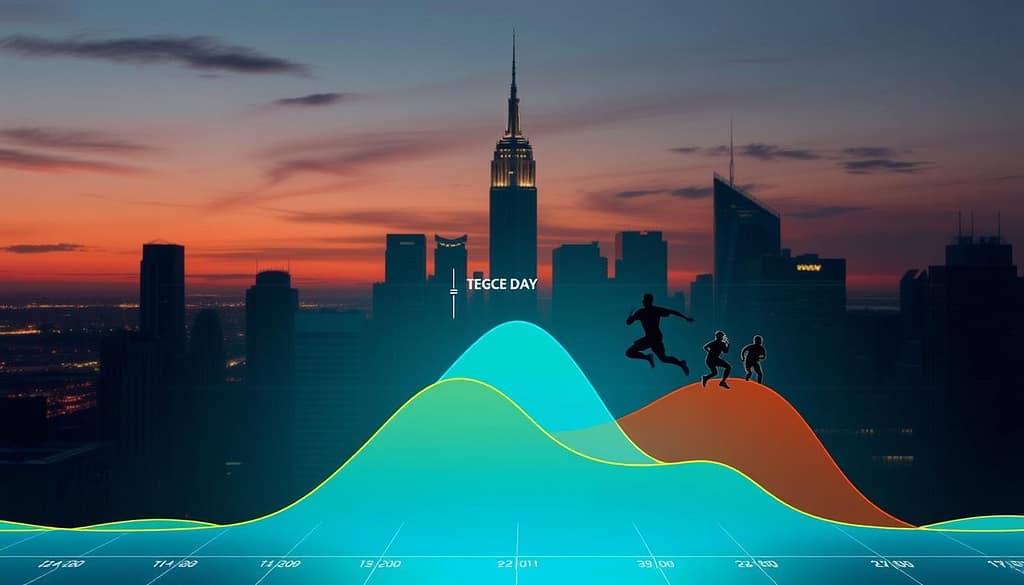
The 24-hour cycle has clear highs and lows. The peak is 11:00 UTC, when London and the U.S. are active. The low is 21:00 UTC, when the U.S. markets close and Asia sleeps.
The data shows a big difference in liquidity. It’s like the market’s pulse—strong in the day, weak at night.
Each session has its own character:
- Asian Session (00:00-08:00 UTC): Quiet, with algorithmic trades and overnight positions. Soccer and tennis are active, but there’s little depth.
- European Session (08:00-16:00 UTC): The market comes alive. Soccer, rugby, and U.S. pre-markets see a lot of action. This is where prices are set.
- U.S. Session (16:00-00:00 UTC): The main event for NFL, NBA, MLB. Liquidity is high, but so is the crowd. Sharp money moves here.
Monday is special, not just because of the blues. It’s a day of big moves. Weekends build up action and analysis. Monday morning brings a flood of opinions, leading to big price changes.
Then, there are the weekend effects. Liquidity seems high on Saturdays and Sundays, thanks to more games and casual bettors. But this is often a mirage. It’s mostly one-sided, recreational money pushing prices up.
The savvy trader knows this. The weekend is for finding undervalued assets, not following the crowd.
These cycles vary by sport. An NFL Sunday is different from an NBA Wednesday. European soccer has its own patterns. The key is to know the liquidity cycles for your sport. This helps you find the best times to trade.
Forget about “prime time.” The real golden hours are based on data, not clichés. Trade with the market’s clock, not against it.
Openers: big edges and big errors—how to qualify them
Imagine a market maker, full of energy and data, making a guess. That’s your opener. It’s a guess that sometimes hits the mark perfectly. Other times, it’s a mistake that creates value for those who notice.
Figuring out an opener is like solving a mystery. You look for clues in how the line behaves and how the market reacts. The key is to see if it’s based on real, sharp money or just noise.
Look at the team totals and alternate lines when an opener is set. If they move together, it means informed betting is happening. But if they’re slow or don’t match, the main line might be just noise.
Speed is also a clue. A line that jumps too quickly might be overreacting. But a line that grows slowly over time shows smart betting.
Big players often wait before making their moves. They look for key levels before stepping in. If an opener ignores these levels, it might be a sign of a weak move.
This waiting game affects how you bet and the prices you get. Catching a sharp opener early is a big advantage. But chasing a noisy one can lead to losing.
So, build your toolkit for spotting good openers. Start with a simple checklist:
- Derivative Sync: Are alt lines and totals moving together?
- Move Velocity: Is the adjustment a spike or a steady climb?
- Level Respect: Did the line pause at key historical prices?
- Order Flow: Is the volume consistent, or is it a few large, panicky bets?
Understanding openers vs closers isn’t about predicting the future. It’s about knowing what’s happening now. Is the opener smart, or is it just reacting to news? Knowing this can make you a proactive bettor.
Following or fading steam; recognizing spoof/noise
Seeing a line move fast and hard is like watching a financial stampede. But is everyone running towards something good or away from danger? This fast movement, called steam, is the market’s most tempting illusion. It makes us want to follow it, but is it real or just a trick?
Knowing the difference is not just about skill; it’s an art. It’s about avoiding fake moves. We’re going to explore steam: the good, the bad, and the fake. To understand this, we look at how big players hide their moves.
An iceberg order is like a hidden bet. Only a small part is seen, like the iceberg’s tip. The rest is hidden, ready to take on other bets without changing the price much. Then, there’s algorithmic timing—trades done quickly to look like real demand. And conditional participation—orders that only act under certain conditions. These tricks help big players hide their bets.
To spot the real deal, look for implied liquidity. This means more than just seeing a line move. Use tools like Bookmap to see the order flow in real-time. You’re not just looking for a small price change. You’re watching for big buy walls, how fast they’re filled, and the delta shift (the difference between buy and sell pressure). Real steam has deep, lasting liquidity. Fake steam is just a flash in the pan.
Let’s make a simple guide. When you see a line moving fast, check if it matches this table:
| Characteristic | Real Steam (Follow) | Noise Steam (Fade) |
|---|---|---|
| Liquidity Depth | Deep, replenishing order walls. Hidden volume (icebergs) present. | Thin, superficial volume. Orders vanish when hit. |
| Speed of Move | Steady, persistent pressure across multiple books. | Violent, spike-like move isolated to one or two books. |
| Market Context | Aligns with a fundamental catalyst (e.g., key player out). | Occurs in a vacuum; no clear news driver. |
| Order Flow Signal | High delta, sustained absorption of opposing offers. | Low or fleeting delta; quick reversal in flow. |
| Your Action | Consider riding the wave. The trend has fuel. | Stand aside or fade. The move is likely a trap. |
Deciding to follow or fade depends on the liquidity story. Is that buy wall real, or just a fake one? If the order flow shows no depth, it’s a sign. It’s fake. The market is bluffing.
Jumping on every fast-moving train is risky. Sometimes, the best move is to wait and see if it’s real. Read the order flow and understand the tricks. This way, you’ll stop chasing fake signals and catch real momentum.
Recreational vs sharp books: pricing tells and shading patterns
Sharp books are like chess grandmasters, while recreational books are like enthusiastic amateurs. This analogy shows how to view every line. Knowing your opponent is key before the game starts.
Sharp books, or true market makers, aim to balance risk and provide liquidity. They don’t guess who will win. Their moves are calculated and efficient, often reacting to other smart money.
Recreational books, or rec books, are different. They focus on balancing their ledger, not pricing efficiently. They attract public bettors, giving smart players many tells.
One big tell is overreaction to public news. If a star player is questionable, a rec book might overprice by Friday. They chase public money, not true value.
Another tell is predictable shading patterns. These books move lines based on public sentiment. If a famous team is favored, the line will get shaved. It’s a mechanical dance.
Lastly, their risk limits are telling. Sharp books might bet big on niche matches. Rec books bet small on big games, showing their fear. This limit is a clear sign of their weakness.
To use this, build a book profile. Look for patterns like their NFL line being off by half a point. This pattern recognition turns betting into a strategy. For more on this, check out understanding bookmaker and market mechanics.
The real edge is knowing if you’re up against a grandmaster or a checkers player. One values precision, the other just wants to finish. Your job is to figure out which and bet smart.
Derivative Markets (Team Totals, Alt Lines) During Shaping
In sports betting, the main line is like the star of the show. But, the real action happens in the derivative markets. Team totals, alternate spreads, and player props show us the hidden story of market microstructure betting.
Imagine sharp money betting on team totals first, not the spread. This is a quiet but clear signal. The main line might not even know what’s happening yet.
An alternate line with a tempting number is another sign. If it quickly changes, that’s a big deal. It shows where the main line is headed.
Why does this happen? It’s all about implied liquidity and order flow. Liquidity naturally congregates at tested price levels. A lot of bets on a specific total show where the real value is.
Here’s how to use these signals:
- Monitor the “whispered conversations.” Watch for early action on a specific team total.
- Spot the instant hammer. If an alt line gets hit right away, it’s a big sign.
- Connect the dots. Movement in these markets often leads to changes in the main line.
It’s like listening to secret talks instead of just the main speech. This info is raw and less filtered. The edges here can be sharper because there are fewer people and less defense.
But, be careful. These markets can be less liquid. A few big bets can cause big moves that might not be real. You need to tell the real signals from the fake ones.
Learning about market microstructure betting makes you more than just a spectator. You become a key player, seeing the whole show being built, not just the end.
Building a timing diary and CLV heatmap
Imagine having a playbook that tells you not just what to look for, but precisely when to look. That’s the power of a timing diary. It’s the difference between being a casual observer and a tactical operator in the market microstructure. All that theory about openers, steam, and sharp books? It’s useless if you’re checking the markets at the wrong hour.
This is where we systematize chaos. Inspired by heatmap data tracking millions in liquidity movements, we plot Closing Line Value opportunities across the weekly calendar. Think of it as a weather map for betting liquidity. When are offshore limits most vulnerable to a sharp move? When does the European professional money typically hit the wires? Your diary holds the answers.
The foundation is raw data: specific hourly depth averages and session analysis. For instance, Monday mornings often see a “high” in available limits as books reset for the week, creating unique time-of-day edges. On the other hand, the volatility reliability metrics—measured by the coefficient of variation—tell us which sessions are noise and which are signal.
Let’s talk about the weekend effects. The “Sunday night sweat” in the NFL is a real phenomenon. Lines can drift erratically as recreational money pours in on game day, often creating late CLV opportunities against the public sentiment. Compare that to the “Saturday afternoon drift” in the Premier League, where early sharp action is often followed by a predictable recreational push. These aren’t abstract concepts; they are executable patterns.
Building your diary involves answering key questions:
- When do my target sports have their deepest liquidity pools?
- When is the coefficient of variation lowest, indicating reliable, tradable volatility?
- What are the peak hours for sharp-contributed line movement versus noise?
You’re not just collecting data; you’re curating a schedule of high-probability interventions. It turns the abstract concept of temporal advantage into a concrete, visual framework. You stop working harder, reacting to every blip on the screen. You start working smarter, positioned ahead of the crowd.
The ultimate goal is a personalized CLV heatmap. This visual tool highlights the windows where historical data shows the greatest disparity between opening lines and closing lines. It identifies those precious time-of-day edges where your attention yields the highest return. By mapping the weekend effects and daily cycles, you transform from a player hoping for an edge into a strategist who schedules it.
Knowledge without a system is just trivia. A timing diary with a CLV heatmap is your system. It’s how you move from understanding the market to out-timing it.
Rules for passing when noise > edge
The highest skill in market microstructure betting isn’t just placing the perfect bet. It’s knowing when to hold back. This restraint is what keeps you in the game.
Your data diary and CLV heatmap are flashing red. Remember Monday 10:00 UTC? That’s when volatility hides as opportunity. The 21:00 UTC hour? That’s when phantom liquidity tricks you. In these times, your edge is hard to find.
We create strict rules for these moments. Rule one: cut down your bet size. Rule two: use limit orders only or don’t bet at all. Rule three: step away. The market is upset. You don’t have to see it.
This discipline is key to advanced market microstructure betting. Your money is not for show. Keep it safe. The real edge will come back to those who stay in the game.