
The world of sports betting is changing fast. Laws and business growth are shaping the industry every day. Big players are shifting their focus to keep up with this change.
Just watching the score isn’t enough to win. You need a state-space approach. This method looks at the whole game situation.
It calculates a dynamic win probability. This turns a messy game into clear trading chances.
Knowing this framework is key for pros. It gives you a systematic edge in both old and new betting places.
Build a simple WP model with states (possession, time, timeouts, foul/penalty)
A win probability model is like a translator. It changes the raw language of live game states into a percentage everyone gets. This percentage is based on data, not just a guess. It lets you compare it with the live market’s odds.
Understanding prediction markets is key. The Athletic’s analysis shows these markets are like exchanges. Prices reflect what everyone believes about an outcome. Your model’s win probability is your own, more precise belief. When they disagree, you find an opportunity.
To build your own model, start by identifying the right inputs. For a basic possession/timeout model, focus on four core states:
- Possession: Which team has the ball/puck? This is the most immediate factor.
- Time Remaining: The game clock and period/quarter/half.
- Timeouts: How many each team has left. A timeout can stop momentum or set up a key play.
- Foul/Penalty Situation: Team foul count, penalty box status, or star players in foul trouble.
Your first model doesn’t need to handle every variable. Focusing on these states makes it clear and manageable. The goal is to assign a historical win probability to each unique combination of these factors.
- Gather Historical Data: Collect play-by-play data for past games. You need to know the score, time, possession, timeout counts, and foul situations at thousands of moments.
- Tag Each Moment: For each historical moment, record the game state. Then, note whether the team with possession won the game.
- Calculate Baseline Probabilities: Group identical states together. If Team A had the ball, down 2, with 1:30 left and one timeout in 100 historical instances, and won 45 of those games, the WP for that state is 45%.
- Apply to Live Games: Feed the current live game state into your historical lookup table. Your model outputs the calibrated win probability.
This simple possession model turns chaos into clarity. It’s not predicting the future magically. It says, “Historically, teams in this exact situation win X% of the time.” The market’s implied probability is its collective answer to the same question.
When your number is significantly different from the market’s, you have a possible edge. This is the core insight. A basic, well-calibrated possession/timeout model can spot these inefficiencies faster and more reliably than gut feeling. It provides a disciplined framework for making live betting decisions, transforming game flow into a series of evaluable probabilities.
Identify trigger states: two‑for‑one, empty‑net, power play, bullpen changes
Trigger states are specific game situations where the odds change quickly. These are the moments your state-space model is built to capture. They show a big difference between the game’s new reality and the odds offered by sportsbooks.
Why are these triggers profitable? They often cause quick pace shifts in gameplay. The market, influenced by anchor bias, may be slow to adjust. At other times, it might overreact. This creates a temporary inefficiency—a clear buy or sell signal for the disciplined trader.
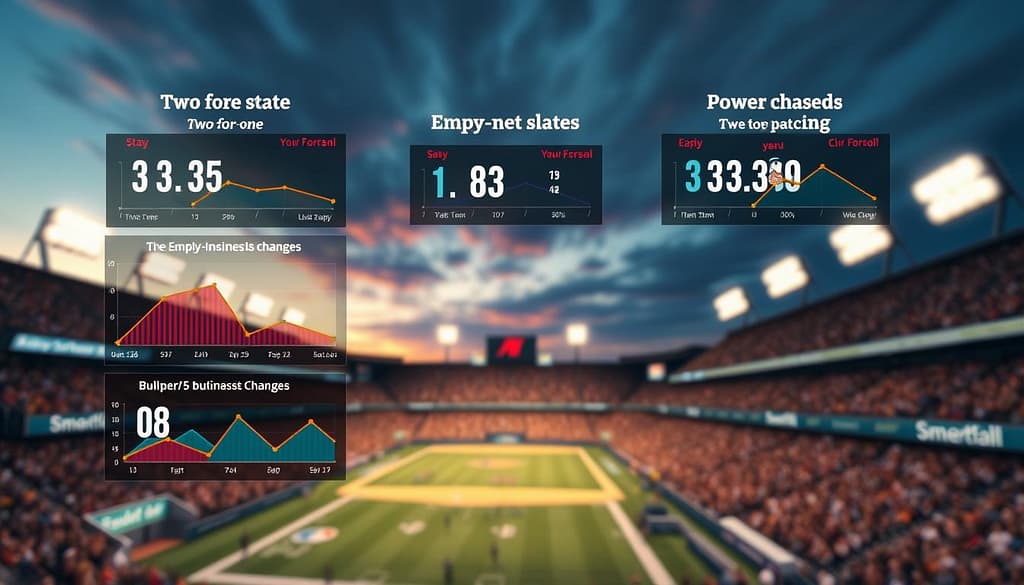
Let’s look at four classic examples from major sports. Each is a structured, repeatable event where the model’s output can flash a strong signal.
In basketball, the “two-for-one” possession is a prime trigger. A team tries to score quickly to get the final shot of a quarter. This deliberate pace shift increases scoring volatility. The market may not fully price the increased chance of points in these last 30 seconds.
Hockey offers two clear triggers. An “empty-net” situation, where a team pulls its goalie, drastically increases the chance of a goal for both sides. A “power play” after a penalty creates a sustained advantage. Both states represent a fundamental change in game dynamics that the model quantifies.
In baseball, a “bullpen change” is a critical trigger. Bringing in a new pitcher alters the expected run environment for the remainder of the game. If a struggling starter is replaced by a elite reliever, the model’s probability for the defending team should spike. The live line might lag behind this new information.
Your model translates these observed states into actionable signals. It compares the new implied probability against the available market odds. When the gap is wide enough, you have your trade.
| Sport | Trigger State | Why It’s a Trigger | Common Market Reaction |
|---|---|---|---|
| Basketball (NBA) | Two-for-One Possession | Forces a deliberate, high-speed possession to get two shots before the quarter ends, increasing scoring chance. | Often slow to adjust to the intentional pace shift and increased volatility. |
| Hockey (NHL) | Empty Net | Offensive team has 6-on-5 advantage, drastically raising goal probability for both teams. | May overvalue the leading team’s chance to score and undervalue the empty-net goal against. |
| Hockey (NHL) | Power Play | Creates a sustained 5-on-4 (or 5-on-3) advantage, shifting expected goals. | Adjusts quickly but can underestimate the duration of the advantage’s impact. |
| Baseball (MLB) | Bullpen Change | New pitcher changes the expected run environment for remaining innings. | Latency in updating lines to reflect the true talent difference between the old and new pitcher. |
Handling latency and suspensions; sizing small and fast
Latency and sudden market suspensions can ruin even the best state-space models. Your edge is only there when you spot a chance and place your bet. Whether you can grab it depends on the market’s speed.
Latency is the delay between seeing an opportunity and your bet being filled. It’s not just about your internet speed. The platform you use makes a big difference.
The Athletic’s data shows a key difference. Traditional sportsbooks take your bet right away. But prediction market exchanges like Kalshi or Polymarket need to match buyers and sellers. This matching process introduces latency, making your signal disappear in seconds.
Market suspensions are another big risk. Books and exchanges stop betting during fast events. A penalty call review or an injury timeout can suspend betting without warning. If your bet is pending, you’re left exposed.
To tackle these challenges, use a disciplined trade sizing approach: small and fast. Your bet size should be small to fit within the platform’s latency window. It also limits your loss if a suspension happens.
This table shows the execution landscape:
| Platform Type | Counterparty | Execution Speed | Suspension Risk |
|---|---|---|---|
| Traditional Sportsbook | The Book (Itself) | Near-Instant | High around key events |
| Prediction Market Exchange | Another Trader | Subject to Matching Latency | High, plus liquidity risk |
Backtesting is tricky because of these realities. A statistical model might look great on paper. But if you can’t execute fast, that edge is gone.
These frictions can sometimes create an opportunity through anchor bias. This is the market’s hesitation to fully adjust to a new game state. When a trigger happens, like a sudden power play, the old odds can linger for a few seconds.
Your small, fast bet aims to exploit that brief window. You’re racing against the market’s own latency. By sizing small, you ensure your order is filled before the market adjusts, turning a behavioral quirk into a real edge.
Mastering this takes practice. Start with small stakes to learn your platform’s rhythm. Know its specific suspension triggers. The goal is to capture many small edges where the mechanics favor you.
Integration: use live edges to hedge/middle pregame positions
The betting world today is spread out across many platforms and rules. This makes it perfect for using live data to balance out bets before the game starts. Your strategy goes beyond just making smart bets. It’s about managing a changing portfolio.
Think about this real situation. Companies like DraftKings and Fanatics are starting prediction markets in certain states. These markets let you bet on things like who will win the season or the championship in all 50 states. You might have a bet on one of these platforms before the game.
Then, the game begins. Your model, based on possession models and key moments, spots a big change in a team’s chances to win. Maybe a key player gets hurt, or a big play goes wrong. This is your chance to act.
You can place a bet on the opposite side of the game on a state-licensed sportsbook to protect your bet. You’re not just making a random bet. You’re using real data to keep your money safe. This mix of platforms turns a quick insight into a smart financial move.

A bolder move is middling. This means you use a price difference between your bet before the game and the current market. Your bet might have been +200 for a team to win. But, if the game turns bad, the odds jump to +350.
The difference between these prices is your chance to make money. By betting on the live side at high odds, you win either way, or at least cut your risk a lot. Your model tells you when to act on this gap.
The rules matter a lot here. Prices on prediction markets and sportsbooks can move differently because they’re in different worlds. This difference is what your model is ready to catch.
To do this, follow a simple plan:
- Establish Your Pregame Position: This is your main bet, made on a prediction market or early sportsbook line.
- Monitor Live Triggers: Watch for changes in possession, momentum, or coaching decisions that change the game’s outcome.
- Execute the Hedge or Middle: On a live-betting platform, take the opposite side or a related bet when your model says it’s time.
This way, live betting becomes a smart strategy. You’re not just chasing the next score. You’re using the game’s live moments to manage and improve your bets from before the game. It’s a mix of planning and quick action, based on understanding the game’s story as it unfolds.
Review: expected vs realized edge per trigger
The final step in your live betting state model is rigorous review. Your win probability model is never finished. Systematic traders must log every trigger state they encounter.
For each trigger, record the expected edge from your models. Then, log the realized edge after the bet settles. This means accounting for real-world factors like latency and execution speed.
This process creates a feedback loop. You can see which triggers, like specific pace shifts or power plays, delivered the predicted value. You can also identify where anchor bias or slow execution hurt your results.
A simple weekly review of this data sharpens your strategy. It shows which parts of your live betting state model are strong and which need refinement. This discipline turns a good idea into a reliable edge.
Continuous improvement separates a professional approach from guesswork. By comparing expected versus realized edge, you empower yourself to adapt and succeed in fast-moving prediction markets.