

Imagine the Death Star project, a huge failure. Now think of it in your office. Your current tech stack is like that project. It’s quietly wasting time and money, waiting to explode.
Numbers show the truth. Companies lose $97 million for every $1 billion spent. Projects often go over budget by 27%. Teams spend almost 22 hours a week looking for documents.
This isn’t about blaming your SaaS subscriptions. It’s a deep dive into your operations. Think of it as a financial and temporal check-up.
Why start with this “before” picture? You can’t know you’ve climbed a mountain without knowing where you started. We’re exposing the cost of doing nothing. This time audit is the first step to making things better.
Define “Success” (CLV %, ROI, Time Saved, Error Cuts)
The boardroom is all about numbers and graphs. Success isn’t just feeling good after a meeting. It’s about spreadsheets that show you’re worth it.
Before you start using new tech, you need to know what success looks like. It’s not just about being more efficient. We’re talking about real numbers that make your tech stack profitable.
Let’s look at what makes a good metric. Is it a 15% jump in Customer Lifetime Value (CLV) thanks to AI chatbots? Or maybe your ROI is so high it impresses CFOs? Kustomer’s CX platform, for example, showed a 422% ROI over three years while service costs dropped 88%.
This isn’t magic. It’s math. And math gets budgets approved.
Your scorecard should track four key areas. These are the pillars of your cost/benefit analysis:
- ROI & Financial Impact: The holy grail. Did the tool pay for itself and then some? The formula is ((Total Gains – Total Costs) ÷ Total Costs) × 100. If you can’t calculate it, you can’t claim it.
- Time Saved & Productivity: Automation boosts productivity by 25–30%. How many minutes are saved each week? Turn that into dollars.
- Error Reduction & Quality: AI cuts error rates by 40–75%. Fewer mistakes mean less rework, higher quality, and a good reputation.
- Strategic Value (like CLV %): The long game. Are you increasing customer loyalty and lifetime value? This metric shows you’re building future revenue, not just saving today’s pennies.
Consider Loop Earplugs. They improved first-response time by 194.52%. That’s a metric with a story. It shows they care deeply about customer service.
Building this scorecard makes you a strategic operator. Every tool trial and workflow tweak must answer the “so what?” question. For more on choosing the right numbers, check out our guide on measuring AI ROI key metrics.
The cost/benefit is clear when you attach a number to each outcome. “Saves time” becomes “Saves 5 hours per week, worth $250 at my billing rate.” “Reduces errors” becomes “Cuts data entry mistakes by 60%, saving 2 hours of weekly correction time.”
This is how you build boardroom ammunition. You’re not just showing a new app. You’re presenting a calculated return on investment that speaks the only language that matters: results. Define success with this rigor, and your tools stop being expenses. They become investments with provable, defendable returns.
Weekly SOP: Research → Bet → Log → Review (With Tools)
Want your software investments to pay off? It’s not about a big plan for the year. It’s about a simple, weekly routine. Think of it as the process SOP for your tech stack. It turns chaos into a well-oiled machine.
Forget about yearly reviews. Success is shown in weekly sprints. Here’s a four-step process that makes you stand out.
Every Monday, ask a tough question: where are we losing minutes? Is it switching between tabs or manual reports? It’s all about the data, not rumors.
Your tool is a Collaborative Work Management (CWM) platform like Wrike or Asana. It’s your go-to source of truth. Look at project timelines and find bottlenecks. Your CWM is like a detective’s case file.
2. Bet (Place a Small, Smart Wager)
Found a problem? Make a small bet. It’s not about spending a lot. It’s about testing a small change. Can a new Zapier automation save time? Will a text expander reduce errors?
The bet is a test. You’re not committing forever. It keeps your budget in check and expectations realistic.
3. Log (Document the Hell Out of It)
This is where many plans fail. A bet without a log is just a dream. Start the experiment and document everything in your CWM. Create a task, note the start date, and what you expect to happen.
This log is your proof. It turns “feels faster” into real data. Teams using CWMs manage 80+ more projects per quarter. It’s not magic, but making every change visible.
4. Review (Did It Work?)
Friday afternoon is review time. Check the log. Did the automation work? Did errors decrease? Did you save time? Your CWM gives the verdict, not your feelings.
This review isn’t just pass or fail. It’s a learning loop. Even if it fails, you learn something. That knowledge goes back into next Monday’s Research phase.
This cycle turns your CWM into mission control. It transforms your tool management into a system, not just a collection of software.
| SOP Phase | Core Question | Tool Arsenal | Desired Outcome |
|---|---|---|---|
| Research | Where is our biggest time leak or error source this week? | CWM Analytics, Time Tracking Apps, Team Feedback Channels | Pinpoint one specific, measurable workflow bottleneck. |
| Bet | What small, low-cost tool or process change can fix it? | Automation Platforms (Zapier, Make), Browser Extensions, Template Tools | A clear hypothesis with a defined scope, cost, and success metric. |
| Log | How do we track this experiment from start to finish? | CWM Task with Notes, Shared Spreadsheet, Dedicated Project Channel | An immutable record of setup, runtime, and initial observations. |
| Review | Did the bet pay off? What does the data say? | CWM Reports, Saved Time Metrics, Error Rate Dashboards | A data-driven decision: Scale, Iterate, or Kill the experiment. |
This weekly process SOP keeps you from wasting money. It makes sure every tool earns its place. You stop collecting software and start making your workflow more efficient, one smart bet at a time.
Cost Controls: Consolidate, Negotiate, Cancel Unused
Your SaaS stack is like a gym with too many unused machines. It’s costing you more than just money. It’s like paying for software seats that nobody uses.
This isn’t just about cutting costs. It’s a detailed time audit of your operations.
The numbers are clear. The average enterprise uses over 900 cloud apps. Workers switch apps ten times an hour, wasting about an hour daily. This isn’t productivity; it’s paid distraction.

So, where do we start? With consolidation. It’s like solving a tech stack puzzle. Your goal is to fit everything together with little waste.
Are you paying for two project management tools that do the same thing? That’s like buying two streaming services for the same shows.
Consolidation is key to saving money. A single work management platform can reduce app-switching. This saves about $13,000 per employee annually in lost productivity. A good time audit uncovers this hidden cost.
Here’s a simple task: List every tool your team uses. Next to each, write its main function. Then, draw lines between tools with similar functions. These lines show where your budget is being wasted on duplicate subscriptions.
Now, let’s talk negotiation. Most vendors have room to negotiate. Use your renewal date as leverage. Schedule a call 60-90 days before auto-renewal. Bring your time audit data to show how much you’ve used.
Ask about:
- Commitment discounts for longer terms
- Bundling with other products from the same vendor
- Educational or nonprofit rates if applicable
- Payment term flexibility (annual vs. monthly)
Canceling unused tools is next. This needs emotional detachment. If a tool hasn’t been used in 90 days, it’s digital clutter. Cancel it. This process is part of your time audit routine.
Create a simple cancellation protocol:
- Quarterly review of all software subscriptions
- Usage analytics check (login frequency, feature utilization)
- Team feedback on actual value delivered
- 30-day warning before cancellation to capture any objections
This financial trimming does more than save money. It frees up mental energy. Every canceled subscription means one less password to remember, one less update to install, and one less notification to ignore. Your time audit becomes a focus audit.
The math is simple. Canceling five $50/month tools saves $3,000 annually. But the real win is the mental energy saved. This is where a good time audit really pays off.
Remember: Software should enhance your workflow, not define it. Each tool must prove its worth in dollars, minutes saved, and errors prevented. Your time audit is the scale for every subscription.
This isn’t just about cutting costs. It’s about smart resource allocation. The budget and attention you save can fund tools that really make a difference. Your tech stack becomes a portfolio of investments.
Your quarterly time audit for costs should ask one question: Does this tool spark profit? If not, it’s time to negotiate or cancel.
Training: Hotkeys, Templates, Automation to Reduce Clicks
Did you know 30-39% of your team’s time is wasted on simple tasks? Many workers say they could do more if they didn’t have to repeat the same tasks over and over. It’s not about working longer hours, but smarter with what you have.
Imagine using a top-notch project management tool but only using it at a basic level. The best feature is often the one nobody knows about. Training unlocks this hidden power.
Arvig is a great example. They didn’t buy a new tool to fix their onboarding problems. Instead, they learned to use their existing Wrike better. They saved over 900 hours a year. That’s a big win for their bottom line.
This part of the article sees training as a key way to save money. Every click saved means more time for the business. Let’s explore how to make work more efficient.
Hotkeys: The Compound Interest of Seconds
Learning basic hotkeys like Ctrl+C and Ctrl+V is easy. But the real power is in shortcuts that save 3-5 seconds on common tasks. Do that 50 times a day, and you save nearly 30 minutes. Over a year, that’s weeks of time back.
Templates: From Complex to Three Clicks
Why start from scratch for every new project or blog post? A good template makes it all quick and easy. It ensures quality and saves mental energy. It’s like having a memory that never forgets.
Automation Rules: Setting Your Tools on Autopilot
Automation is where the real savings happen. Set up rules for task assignment and reporting. Automate reminders for deadlines. It’s not about replacing people, but freeing them from tedious tasks. The cost/benefit is clear: a few hours of setup saves hundreds of hours later.
The numbers show that training leads to fewer clicks, lower costs, and more work done. It’s a simple yet powerful way to improve. Stop wasting time and teach your team to use all the tools at their disposal.
Every week, ask yourself: “What shortcut or template can we learn to save 100 clicks?” Make it a goal. This turns training into a weekly win.
Experiment Logs: New Tool Trials With End Dates
Every new tool needs a trial period with a clear end date. It’s like probation for software. Without this, your workflow fills with abandoned subscriptions, showing failed plans and poor action.
“Let’s just try this new AI thing” is not a strategy. It’s the start of a costly comedy. Real innovation needs rigor, not random tech tries.
The experiment log is like your lab notebook. Inspired by Forrester and BCG, we create a trial framework with real teeth. You’re not just playing with toys; you’re running a controlled experiment.
The core of this process SOP is simple: treat every tool like a venture capital investment. Small initial bet. Rigorous metrics. A definitive go/no-go decision point. This kills tool sprawl before it grows too big.
Your experiment log should track four key dimensions:
- The Hypothesis: What specific problem will this solve? “Make us faster” is vague. “Reduce manual data entry in our weekly report from 2 hours to 15 minutes” is testable.
- The Metrics: What numbers prove success? Time saved, error rates, cost per task. Compare against the Total Cost of Ownership (TCO), not just the subscription fee.
- The Timeline: Set a firm end date—30, 60, or 90 days. The 12-18 month ROI horizon from major studies is your north star, but the pilot must show directional promise quickly.
- The Verdict: Keep, kill, or iterate. No limbo allowed.
This transforms your workflow from a passive consumer of features into an active laboratory for measurable innovation. The process SOPs you build here create institutional memory. You stop making the same “shiny object” mistakes.
Implementing this isn’t about bureaucracy. It’s about building a culture of accountable curiosity. Each logged experiment, whether a success or a failure, makes your next decision smarter. Your tool stack becomes lean, purposeful, and constantly evolving—not just randomly accumulating.
That’s the power of a disciplined process SOP. It turns fleeting enthusiasm into lasting advantage.
Report Card: Tools vs Outcomes, Keep/Kill Matrix
The weekly reviews are over. Now, we do the ultimate time audit. We sort out what’s essential from what’s just a waste of time. It’s time to grade, and remember, there are no participation trophies here.
Every software you pay for is now on trial. The verdict? It’s based on the data we’ve collected. Did the AI writing assistant really save 5 hours a week? Or did it just add more work?
We use the ROI formula for our final report card: Total Gains vs. Total Costs. But gains aren’t just about money. They’re about time saved, stress reduced, and happier customers. This is where dreams meet reality.
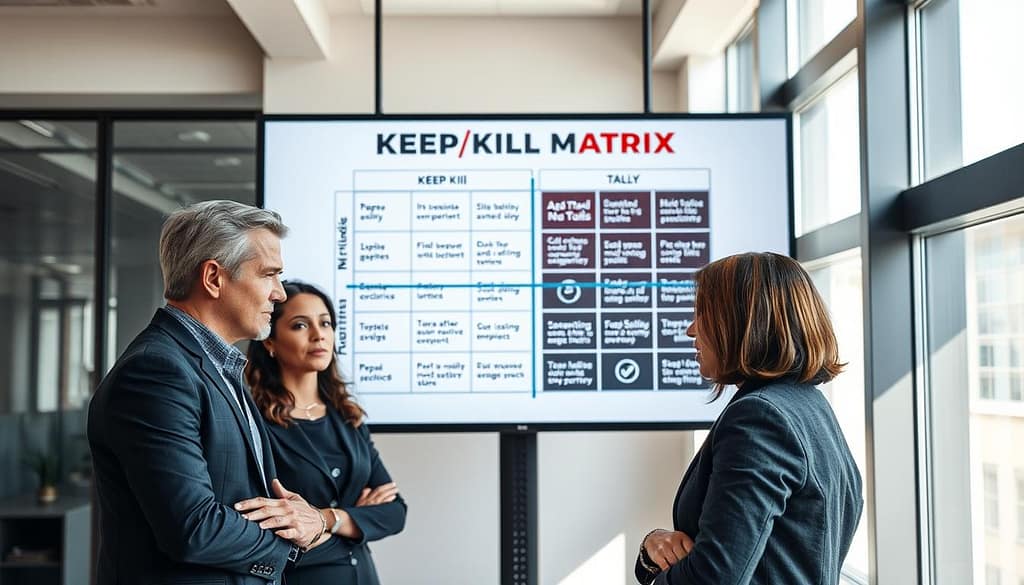
Your most powerful tool is the Keep/Kill Matrix. It’s a tough, smart way to decide what to keep. Think of it as managing your productivity like a portfolio.
How does it work? You plot each tool on two axes: Value Delivered and Cost & Complexity. The results are clear.
| Tool Category | Value Delivered | Cost & Complexity | Verdict & Action |
|---|---|---|---|
| The Workhorse | High. Exceeds ROI targets, saves significant time, improves core metrics. | Low/Justified. Cost is a fraction of value. Fits seamlessly into workflow. | KEEP & DOUBLE DOWN. Explore advanced features. |
| The Question Mark | Medium. Shows promise but data is inconsistent or gains are marginal. | Medium. Some cost and learning curve. | KILL (with a trial extension). Set a strict 60-day improvement deadline with new success criteria. |
| The Barnacle | Low. Fails to deliver on core promises. “Nice-to-have” at best. | High. Expensive, clunky, and creates extra steps. | KILL IMMEDIATELY. Cancel subscription. Archive data. Move on. |
| The Sunk Cost | None/Negative. Actively creates problems or wastes time. | Any level. The damage outweighs any cost. | KILL YESTERDAY. This is actively harming your operation. |
This matrix makes you think like a CEO, not a fan. That fancy analytics platform? If it doesn’t change anything, it’s a waste. But that simple script that saves 30 minutes a day? That’s a gem.
Check the changes at 30, 60, 90 days, and 6 months. Trends are your ally. A tool improving over time might be worth keeping. But one that’s not? It’s time to let it go.
Is this harsh? Only if you think being smart with money is harsh. This process is like your tech stack’s immune system, getting rid of what’s not needed. The end result? A leaner, meaner, outcome-generating machine. Finish your audit, use the matrix, and create a toolkit that’s worth every penny.
Building Redundancy Without Bloat
The GDPR fine could be 4% of your global turnover. This makes smart redundancy an investment in survival. We often see duplicates as unnecessary weight. But in risk management, redundancy is like armor.
It’s the difference between a temporary outage and permanent damage to your brand.
The cost/benefit math should keep executives up at night. One data breach or compliance violation can cost a lot. It can erase years of efficiency gains in one moment.
Automation is like premium insurance. You pay for it, hoping you never need it. When a key developer quits, your automated pipeline keeps working.
This makes the cost/benefit analysis interesting. How much is it worth to prevent a $17,000 scam? United Airlines paid that amount to a teenager who found a loophole.
A little redundancy in their booking system’s validation logic would have saved them money.
Building smart fallbacks means cross-training teams and documenting processes. This way, knowledge isn’t trapped in one person’s head. It’s creating “knowledge silos” that preserve institutional memory.
The goal isn’t to create a bureaucratic nightmare. It’s to build minimal, elegant architecture that scales without increasing risk. When you grow from 10 to 100 employees, your risk shouldn’t multiply by ten.
The elegant cost/benefit balance is having one primary tool with a backup plan. A team with at least two people understanding critical systems. Automation rules that prevent expensive human errors. It’s like having a spare tire—you don’t carry five, but you definitely have one.
Redundancy becomes bloat when it’s added without purpose. But purpose-driven redundancy is just smart business. It’s recognizing that people take vacations, make mistakes, and sometimes pursue unexpected lottery winnings. Your workflow should survive all three.
In the end, building redundancy without bloat is about acknowledging reality. Systems fail. People leave. Regulations change. Your job isn’t to prevent every possible issue—that way lies madness and bureaucracy. Your job is to ensure that when the inevitable happens, your business doesn’t just survive. It barely notices.
Responsible Use Guardrails in Every Step
Your process SOPs should guide your tools, but also tell them what not to do. This makes a big difference between a smart script and a top-notch system. Without limits, automation can lead to big mistakes, like an unwatched intern.
We’re adding ethics and compliance to your workflow. It’s moving from “move fast and break things” to “move smart and protect all.” This is a more responsible approach.
Guardrails are like safety systems on a fast train. They let you go fast without crashing. In your process SOPs, add special checks:
- Approval Gates: For big actions, like sending emails or making big trades, ask a human first. It’s a simple yes or no.
- Immutable Audit Trails: Log every action, like social media posts or data checks. Include who did it and when. This helps fix problems and defend against them.
- Ethical & Compliance Checkpoints: Use tools like AWS’s Verafin to check for financial crimes. Make similar rules in your SOPs. Ask if actions are okay and if they follow rules.
These guardrails turn risk into something you can manage. The benefits aren’t just avoiding big fines or damage to your reputation. It’s also about being able to automate more. With safety features, you can go faster.
Think about a compliance check that used to take three days. With real-time checks, it now takes seconds. This isn’t just faster; it’s safer.
Check your process SOPs for weak spots. Where are you just hoping for the best? Add the checks, keep logs, and ask the right questions. These steps aren’t limits; they’re the base for a reliable system. That’s how you create something that lasts.
Quarterly Optimization Checklist
Your workflow isn’t a museum piece. It’s a living system that needs regular tune-ups. Think of this checklist as your recurring calendar invite to greatness—the quarterly service appointment for your digital toolkit.
We’re making improvement a habit. Every quarter, do a mini time audit. Review your keep/kill matrix like you’re pruning a garden. Renegotiate one vendor contract—your Asana or Zapier subscription shouldn’t sleepwalk through another billing cycle.
Test one new hotkey or template. Check the health of your guardrails. This rhythm follows ROI experts’ advice: regular checkpoints at 30, 60, 90 days, then quarterly forever after. That initial time audit you performed becomes your baseline for all future measurements.
Optimization is a cycle, not a destination. This system ensures your tool ROI doesn’t peak and plateau. It compounds. Your workflow runs lean, mean, and pays for itself, quarter after quarter. Now go set that calendar reminder.