

Imagine a political rally. The crowd cheers for one candidate. But the big donors secretly support the other. This is what public splits are all about.
This isn’t just a popularity contest. It’s about the tension between hope and money. The “ticket count” shows where people put their faith. The “handle” reveals where the real money goes.
This information comes from sportsbooks and aggregators. But remember, it’s not always reliable. It’s like a delayed news report, influenced by what’s reported.
Start by being a critical thinker. Know what these numbers mean and what they don’t. For a detailed look, check out our guide on betting splits.
Now, let’s uncover the truth. The game is about to start.
Tickets vs Handle: Interpreting disparity and timing
Betting markets are like a concert. Tickets are the fans in the nosebleeds, and handle is the VIPs in the front row. This shows the difference between casual bettors and serious analysts. Most people look at numbers and think everyone agrees. But sharp minds ask: “Yes, but whose money is it?”
“Tickets” or Bet Percentage is the number of bets. It’s like every bet counts the same, no matter the size. This shows what the public thinks, influenced by emotions and opinions.
“Handle” or Money Percentage is the total money bet. It’s like the big money talks louder. Here, a big bet can overshadow many small ones. The handle shows what smart money thinks.
A big difference between tickets and handle is key. It shows the market’s true feelings. For example, only 7% of bets were on Cleveland, but 49% of money was on them. The crowd didn’t like Cleveland, but the big money did.
This shows a big gap between what people think and what money says. The public was against Cleveland, but most money was for them. This isn’t just a mistake. It’s a sign of smart money betting against the crowd.
Timing Changes Everything
A difference in bets early in the week is different from one just before the game. Early bets are often made by big players planning ahead. Late bets are quick and often based on new information.
Here’s how to understand timing in your ticket vs handle analysis:
- Early Week Disparity: Shows big money or syndicates at work. They have time to plan and bet slowly.
- Mid-Week Convergence: If the gap narrows, it means public money is catching up. Or the other way around. Watch which side is moving.
- Pre-Event Spike: A sudden increase in bets before the game is a strong sign. It shows money that needs to bet now, often based on inside info.
Think of it as studying two groups: the Ticket Tribe and the Handle Tribe. When they move differently, it’s important to understand why. Is the Handle Tribe moving to safer bets? Or are they betting on value that others miss?
The key takeaway is simple but important: Always compare ticket percentage with money percentage. If many bets are on the Cowboys but not much money, there’s a problem. The crowd is loud, but the money is quiet. Your job is to decide who to trust.
This ticket vs handle approach makes confusing data clear. It helps you see the difference between noise and signal. By understanding this, you can stop following the crowd and start tracking the money that really moves markets.
Multi‑Source Normalization (avoid single‑feed bias)
If your betting strategy relies on data from just one source, you’re betting blind. Single-feed bias can kill your profits. It’s like getting news from only one channel, seeing a biased view of reality.
Why does this happen? Each sportsbook has its own world. DraftKings might attract casual bets on popular teams. BetMGM might have sharp players influencing markets. FanDuel’s data might update slower during busy times.
The solution is data triangulation. It’s like using multiple points to find your exact location. In betting, it means using data from at least three sources to find the consensus reality.
Here’s how to normalize data from multiple sources:
- Maintain multiple funded accounts across different sportsbooks. This isn’t just for line shopping—it’s for data shopping. You need access to each book’s unique betting pulse.
- Subscribe to at least one independent tracking service that aggregates data across books. These services act as your neutral ground truth.
- Create a simple spreadsheet or use tracking software to log key metrics (percentage of bets, percentage of handle, line movement) from each source side-by-side.
- Look for discrepancies. When one book shows 70% of bets on Team A but another shows only 55%, that’s not noise—that’s a signal begging for investigation.
The magic happens in the gaps between data sets. A line moving against the public at Book A but not at Book B tells you where real sharp money is landing, not just theoretical steam. It’s the difference between hearing a rumor and confirming it with multiple witnesses.
This approach makes you an active analyst. You’re no longer asking, “What does DraftKings think?” You’re asking, “What does the market think?” This shift in perspective is what separates recreational players from serious analysts.
Remember, sportsbooks aren’t charities. They’re businesses with their own interests. Multi-source normalization is your intellectual armor against their biases. It’s how you build your own little NSA for sports betting—seeing the full picture when others see only fragments.
Reverse Line Moves & Steam: signal vs noise
Market movements often whisper and shout. The reverse line move whispers, while steam shouts. Both make the oddsboard twitch. But only one is worth your attention.
Think of it this way. The public bets with their hearts. Sharps bet with algorithms. When these forces meet, the line tells a story. Your job is to read between the point spreads.
The Whisper: Anatomy of a Reverse Line Move
A reverse line movement is the market’s quiet rebellion. The public backs Team A, but the line moves toward Team B. This is the market’s whisper.
Take the Patriots vs. Bills scenario. New England starts as +6 underdogs. Yet, the line tightens to Patriots +5.5, despite 80% betting on Buffalo.
What’s behind this? The sportsbooks respect sharp money on the Patriots. This is fading the public in its purest form.
This whisper tells you smart money disagrees with the crowd. It’s a calculated move, not a panic.
The Shout: Decoding Steam Moves
Now for the shout. A steam move is like a flash mob. It’s quick and efficient. Michigan goes from +5.5 to +4.5 in no time.
This is a sledgehammer move. A betting syndicate or algorithm spots a soft line. They bet big to force books to adjust.
Steam is all about sharp force. It’s about exploiting a pricing mistake before it’s gone.
Both moves change the line. But their reasons and messages are different.
| Characteristic | Reverse Line Move (RLM) | Steam Move |
|---|---|---|
| Speed of Movement | Gradual, persistent pressure | Rapid, often within minutes |
| Typical Initiator | Multiple sharp bettors fading public sentiment | Single syndicate or algorithm exploiting price |
| Public Betting Pattern | Heavily one-sided (70%+ on one side) | Can be any distribution; irrelevant to the move |
| Market Impact | Corrective move based on sharp vs. public imbalance | Forced move based on concentrated betting volume |
| Signal Strength | High—indicates strong sharp consensus against public | Variable—can be strong signal or mere market panic |

Signal vs Noise: The Art of Discernment
How do you tell market genius from madness? Context is key. A reverse line move early on is a strong signal. But the same move late might just be bookmaker balancing.
For steam, ask if there’s a logical reason. Did a key injury happen? Did a respected model find a value? If yes, it might be a signal. If not, it’s likely noise.
Remember, signals have stories. Noise is random. A reverse line movement tells the story of sharps opposing the public. True steam tells of finding a mispriced asset.
Your edge is in knowing which moves tell a story. The market whispers and shouts all day. Learn to listen for the sentences, not just the sounds.
Limits Timeline and Market Maturity (why it matters)
Market maturity is like a silent clock ticking behind every line movement. Ignoring it is like betting blindfolded. You might win, but you’re playing a different game than the sharps who watch this clock religiously.
Think of a betting line like a fine wine or a blockbuster movie’s opening weekend. It has distinct phases. Monday’s opening line is the preview screening—full of promise, but untested by the masses. By Wednesday, we’re in wide release. The critics (sharp bettors) have weighed in. By Sunday morning, we’ve reached the consensus box office numbers. The market has matured.
This maturation process isn’t abstract. It’s measured in cold, hard cash and the limits books are willing to accept. A limit bet is the maximum wager a sportsbook will take on a given line. When you see a limit bet get placed, it’s like a whale revealing its hand. It’s the financial equivalent of a celebrity endorsement on opening night.
Let’s use the classic example. Say the Patriots open as -1.5 favorites on Monday. By Tuesday, sharp money targets that early-week value, pushing the line to -2.5. This is early steam—smart money acting on its read before the public floods in. The line hardens. By Saturday, it sits at -3. Was that final move more sharp money or just public sentiment piling on the favorite? The timeline provides the context.
Here’s the key distinction many miss. A line moving from -1.5 to -2.5 on Tuesday tells a different story than the same move from -2.5 to -3 on Sunday. The early move suggests fundamental value was found. The late move could be noise—square money following trends, or books adjusting for balanced liability.
Your data analysis must be timestamped. Looking at betting percentages without knowing when they occurred is useless. Seventy percent of bets on the underdog means one thing on Tuesday and something entirely different on Sunday. The market’s age defines the meaning of the data.
So, why does this matter for your decisions? If you’re hunting for value, your window is early. You’re competing with other sharps for that newborn line. If you’re riding consensus or looking for contrarian plays, your game is later in the week. You’re reading the crowd, not finding mispricing.
Understanding market maturity frames everything. It tells you whether you’re looking at a discovery phase or a confirmation phase. It separates signal from noise based on chronological context. In the end, timing isn’t just everything in comedy. It’s everything in sharp betting analysis too.
Case Studies: Side, Total, and Prop examples with tags
This section is like a movie montage where everything falls into place. We’ve covered the basics—ticket vs. handle, RLM, steam moves. Now, let’s see them in action. These aren’t just theories. They’re real examples with my analysis tags. Think of these tags as your guide for future games.
The Side Bet: When the Line Screams “Sharp on the Dog”
Remember the Patriots vs. Bills example? Let’s dive into it. Buffalo was a 3-point home favorite. The public loved the Bills’ offense, betting heavily on them. Tickets were 68% on Buffalo.
But the handle told a different story. Money was almost even, despite the ticket imbalance. This showed a few big bets were on New England. The line didn’t move much, staying at -3 then dropping to -2.5.
This is a classic ticket/handle mismatch. The crowd bet on one team, but smart money was on the other. New England won easily. The tag for your tracker: [RLM CONFIRMED] + [SHARP DOG]. When tickets and money disagree, and the line moves against the ticket percentage, the sharps have tipped their hand.
The Total Bet: Public Sentiment vs. The Immovable Line
Totals can be tricky. People often bet on offense. Let’s look at a real NFL example: Cleveland Browns at Baltimore Ravens, with a total of 44.5 points.
The story was perfect for an Over bet. Two rivals, a Ravens offense that had been explosive. The public bet on the Over, expecting a high-scoring game. Here’s what the data showed:
| Bet Type | Public Bet % | Public Money % | Line Movement | Analytical Tag |
|---|---|---|---|---|
| Spread (CLE +6.5) | 61% on CLE | 55% on CLE | Moved to +7.0 | [MODERATE PUBLIC DOG] |
| Moneyline (BAL) | 72% on BAL | 85% on BAL | Odds shortened | [HEAVY PUBLIC FAV] |
| Total (Over 44.5) | 78% on Over | 42% on Over | Held at 44.5 | [PUBLIC TRAP] |
See the red flag? 78% of tickets were on the Over, but only 42% of money was. The line didn’t budge, staying at 44.5.
The books were inviting bets on the Over. But the sharp money was on the Under. The game was a defensive battle. The tag here is [PUBLIC TRAP]. When the public is all in on one side of a total, but the line doesn’t move, trust the line. It’s usually protecting the sharp side.
The Player Prop: Finding Mispriced Narrative
Prop markets are driven by stories. Last night’s hero is today’s overpriced player. Imagine a star quarterback coming off a big game. His passing yardage prop is set at 290.5.
The public bets on the Over, expecting another big game. But the line doesn’t move to 295.5. It might even go to 289.5. Why? The matchup is tough, with a top pass defense that blitzes a lot. The sharps know this, but the public doesn’t.
By tracking the ticket percentage on the prop and watching the line, you can spot this sentiment mismatch. The public bets the story. The sharps bet the context. In this case, the tag is [SENTIMENT MISMATCH]. It tells you the public is chasing a narrative that the oddsmakers have already adjusted for, creating value on the other side.
These tags—[RLM CONFIRMED], [PUBLIC TRAP], [SENTIMENT MISMATCH]—are your shorthand. They turn a complex observation into a quick, actionable note. Log them. Pattern recognition is what turns data into an edge.
Decision Tree: Bet now, wait, or pass
Analysis paralysis can freeze even the sharpest minds. Here’s how to thaw yours with a logical decision tree. You’ve gathered data, spotted splits, and tracked line moves. Now, it’s time to make a clear, executable action.
This isn’t about finding a crystal ball. It’s about building a cognitive flowchart that turns uncertainty into calculated probability.
Think of it like a choose-your-own-adventure book. Instead of dragons and treasure, your foes are public sentiment and closing line value. Your goal is to answer three core questions. The answers will guide you toward one of three outcomes: BET NOW, WAIT, or PASS.
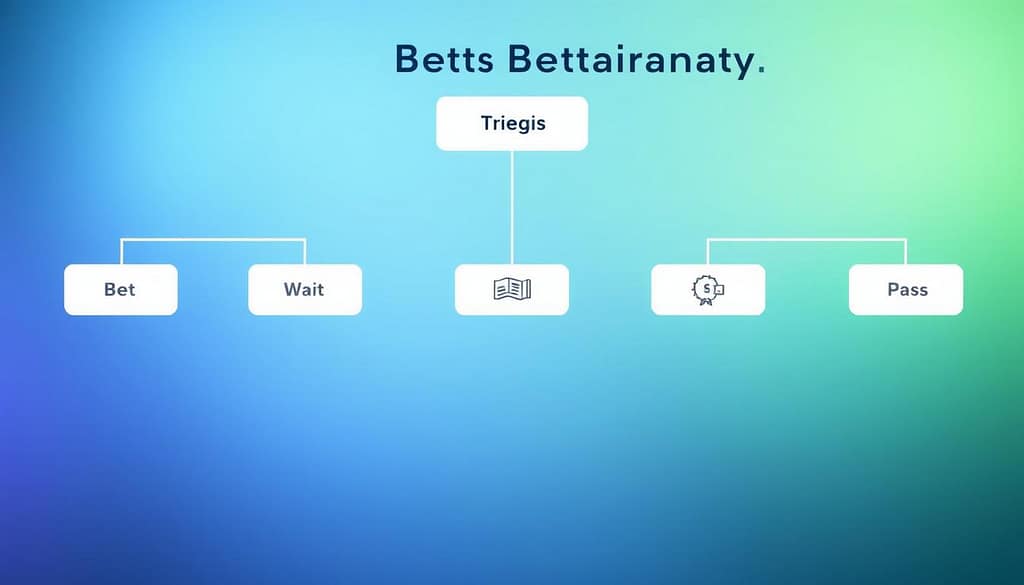
The Three Checkpoints
Before you even glance at your betting slip, run your play through this diagnostic. It’s the triage unit for your bankroll.
1. The Split Test: Is there a meaningful ticket vs. handle disparity? A heavy handle on one side with lopsided public tickets is your first green light. If the split is negligible or confusing, your journey might end here.
2. The Confirmation Signal: Does a reverse line move back up the split? This is where sharp money often tips its hand. If the line moves against the public, you have a powerful signal. No confirming move? Proceed with caution.
3. The Timing Read: Has the market matured, or is this early-week value? Sharps often target soft, early numbers. If you’re looking at a Sunday night line for a Monday game, the value might already be arbed away. Understanding where you are in the limits timeline is key.
Your Decision Branches
Based on your diagnostic, your path becomes clear. This is where discipline separates profit from hope.
BET NOW (The Edge is Clear and Present)
You hit the trifecta: a clear split, a confirming reverse line move, and catching the play early. The edge is visible, quantifiable, and likely shrinking as you read this. This is a decisive action moment. Hesitation is the enemy. Place your bet and let the market work.
WAIT (The Edge Might Improve)
You have a strong split and maybe a slight line move, but the public hasn’t fully piled onto the wrong side yet. The line might get even more favorable if Joe Public continues to bet with his heart. Here, patience is a weapon. Set a line target and be ready to pounce if it hits. This is classic sharp behavior—staking out a position and waiting for the crowd to deliver you a better number.
PASS (The Signal is Weak or Contradictory)
The data is murky. The split is insignificant, the line is static, or different sources tell conflicting stories. This is not a failure. This is a strategic non-action. Passing on confusing situations preserves your capital for the clear edges. Remember, the goal isn’t to bet on every game; it’s to bet intelligently on the right ones.
This decision tree isn’t a guarantee—nothing in betting is. It’s a systematic filter for emotion. It forces you to qualify your plays against objective criteria before your gut or your FOMO can shout louder. Use it to build discipline, one logical decision at a time.
Logging Findings: Tags in tracker for future edges
Think of your betting tracker as a lab notebook for market experiments. The best bettors don’t just bet; they do fieldwork. They note every detail, from small line changes to big public money moves.
This isn’t just busywork. It’s how you create your own betting strategy, one piece of data at a time.
Why is this important? One odd game is just noise. But a season’s worth of odd games shows patterns. For example, a Thursday night home underdog with a reverse line move might hit 58% of the time over three seasons.
Keeping records makes you a predictive thinker, not just a reactive analyst. You start to see future opportunities instead of chasing yesterday’s signals. Your tracker becomes about understanding the market’s behavior, not just what you bet.
This shift is key.
The Archivist’s Advantage
Your logging system doesn’t need to be complicated, but it must be consistent. Use a dedicated app or a simple Google Sheet. Each entry should tell more than just “win” or “loss.”
You’re documenting the market’s story for that event. Note the ticket/handle disparity, steam moves, and when limits changed. Tag these moments like a historian.
A Simple Tagging Framework
Create columns or tags for these key observations:
- Signal Type: RLM, Steam, Public Trap, Limit Change
- Market Context: Primetime, Rivalry, Injury News, Weather
- Source Confidence: Single Source vs. Multi-Source Confirmation
- Timing: Early vs. Late Move, Pre- vs. Post-Limit Change
- Outcome & Notes: What happened and your post-mortem thoughts
This framework turns random notes into data you can analyze. Six months later, you can filter for specific patterns and see your results. This is power no generic service can offer.
From Data to Edge
The magic happens during your weekly review. Look at more than just profits and losses. Analyze your tags for patterns. You might find that steam moves on totals after key player announcements are profitable for you.
Or that public favorites in divisional games often fail to cover.
These are your documented realities, not theories. This process turns your betting history into your most valuable resource. Each logged finding becomes a hypothesis for your next market experiment.
Remember: The house keeps detailed records. The sharpest syndicates have huge databases. Your personal tracker helps you compete. Treat your observations as valuable. Tag everything. Review often. Watch your edges grow faster than your bankroll.
Compliance & TOS: safe usage, caching, rate limits
Using public betting data is like driving a sports car. You need to know the rules of the road. If you ignore them, you’ll end up on the sidelines quickly.
This section is not about stopping you from having fun. It’s about making sure your data-driven engine runs smoothly and legally. This keeps you within the regulated ecosystem.
Let’s talk about the Terms of Service. Every sportsbook has one, and it’s full of important rules about data usage. Most sportsbooks say you can’t scrape their odds or public betting percentages. They do this to protect their intellectual property and market signals.
This isn’t about being petty. It’s about keeping their business model safe. Third-party data aggregators offer legal data feeds. This way, you get normalized, compliant data without scraping the book’s front end.
For tech-savvy users, there’s the rate limit. It’s like a bouncer at an exclusive club. Too many requests too quickly, and you get cut off. Rate limits prevent server overload and ensure fair access for all users.
Respecting these limits is key for continuous data flow. Exceeding them can lead to temporary blocks or permanent access revocation. Your edge disappears if you’re too greedy with requests.
Caching is a smart solution. Instead of querying the API every time, store data locally. This reduces API calls, respects rate limits, and speeds up analysis. It’s like taking notes instead of asking the same question repeatedly.
At the heart of all this is responsible gambling. Those disclaimers are not just legal stuff. They remind you to gamble wisely. Using data to find an edge is smart gaming. Betting more than you can afford is a big mistake.
| Compliance Area | What It Means | Practical Action | Risk of Ignoring |
|---|---|---|---|
| Terms of Service (TOS) | Legal rules set by sportsbooks governing data access and usage. | Use licensed third-party data aggregators instead of direct scraping. | Legal action, account termination, loss of bankroll. |
| API Rate Limits | Maximum number of data requests allowed per minute/hour by a service. | Space out your requests; implement query intervals in your code. | IP/API key ban, loss of real-time data access. |
| Data Caching | Storing retrieved data locally to avoid redundant API calls. | Set up a local database or file system to store odds for 1-5 minutes. | Unnecessary API calls, hitting rate limits, slower analysis. |
| Responsible Gambling | The ethical framework ensuring betting remains within personal limits. | Set strict bankroll rules; use data for smarter bets, not bigger bets. | Financial loss, problem gambling behavior, negating any data edge. |
Technical compliance (rate limits, caching) keeps your data pipeline open. Legal compliance (TOS) keeps you in the game. Ethical compliance (responsible gambling) ensures the game is worth playing. It’s a three-legged stool—remove one, and the whole operation becomes unstable.
The sharpest mind in sports betting isn’t the one that finds the most clever edge. It’s the one that understands how to pursue that edge sustainably within the rules. That’s how you move from being a player to being a pro.
Post‑Mortem Framework to Improve Reads
The final whistle blows. Your bet settles. For the public, the story ends there. For the sharp bettor, the real work begins.
This is your post-mortem analysis. It’s the autopsy of every decision. Win or lose, each wager is a data point screaming for review. Did the public betting data signal correctly? Did that reverse line move you followed pan out? Was the steam genuine or just market noise?
Elite bettors typically win only slightly more than they lose. The margin is razor-thin. Your edge isn’t found in celebrating victories. It’s carved from dissecting defeats.
Build a simple framework. After cash settles, open your tracker. Grade your process, not the result. A bad beat with perfect data analysis is a good read. A lucky win on flawed logic is a disaster in disguise.
Ask the brutal questions. Did you misinterpret the ticket versus handle disparity? Was your timing on the market move too early or too late? Which sportsbook’s line movement proved most reliable—was it DraftKings, FanDuel, or BetMGM?
This isn’t about self-flagellation. It’s calibration. Your goal is to refine your interpretation of public betting data. Sharpen your instinct for true sharp betting signals. Transform experience into pattern recognition.
Enjoy your wins, absolutely. Learn from the losses, relentlessly. This framework closes the loop. You’re not just placing bets. You’re conducting a masterclass in market psychology, with yourself as the only student. The next game is always coming. Your reads should be getting sharper.