
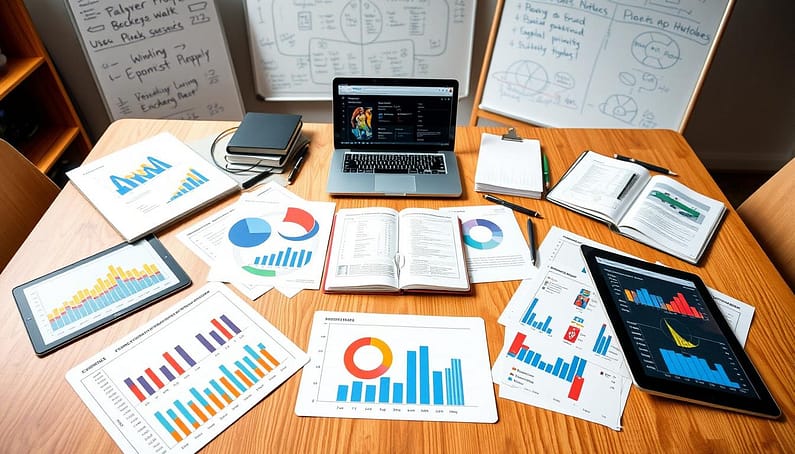
Forget the casino. The modern props market is like a chaotic library. A few people are shouting over the Dewey Decimal system. Your edge isn’t found in some shiny, overpriced algorithm.
It’s built on a simple, brutal shift. Moving from a gambler who believes in luck to an analyst who understands probability. This is the foundation of a real props research toolkit.
The smart approach isn’t collecting subscriptions like trading cards. It’s constructing a research framework so solid. It makes the sportsbook’s line look like a hopeful guess. The first tool you need isn’t a website. It’s a healthy dose of skepticism for anyone promising easy money.
The real work begins with raw data. You start with the game logs and ask one piercing question. What is this data actually telling me, and what story is it desperately trying to hide?
This is where you stop winging it and start building from the ground up. Let’s cut through the noise.
Core inputs: minutes, usage, pace, opponent scheme
Understanding a player’s output starts with four key areas: time, touches, tempo, and trouble. Forget about season averages. We’re building a detailed plan from scratch.
First, minutes projections. This isn’t just guessing how long a player will play. It’s a deep dive into the reasons behind it. Why did Anthony Edwards play 39 minutes against Phoenix but only 33 against Detroit? Was it foul trouble, a specific matchup, or a blowout?
Second, usage rate. This shows a player’s share of the team’s possessions. A star with a 30% usage rate is the offense’s leader. A role player at 15% plays a supporting role. Usage reveals who’s in charge when it matters most.
Third, pace. This changes everything. A fast-paced team like Indiana turns games into high-scoring affairs. More possessions mean more chances to score and rebound. Pace is key to understanding a player’s impact.
Lastly, opponent scheme. This affects how a player performs. Are we facing a defense that focuses on one player, or one that leaves open shots? Scheme analysis helps us see if a player’s strengths will shine or be overshadowed.
These four areas work together. High pace benefits players who get more touches. A favorable matchup means more minutes projections for the hot hand. It’s a dynamic system, not a simple formula.
Take Kevin Porter Jr. for example. His increased opportunity wasn’t just a number after Damian Lillard left. It was a story of more usage, guaranteed minutes, and a team needing scoring. The data told a clear story.
Give these core inputs the respect they deserve. They are the building blocks of your analysis. Get them wrong, and your whole analysis falls apart.
Distributions: Poisson/negative binomial intuition
When you see ‘2.5 rebounds’ for a backup center, it’s not a prediction. It’s a challenge to think probabilistically. The sportsbook line is a market-clearing price, balancing bets. Our task is to model the actual distribution of outcomes.
Most player stats are discrete and often skewed. Events like assists, rebounds, and three-pointers don’t follow a normal distribution. The Poisson and negative binomial distributions are key tools for us.
Let’s simplify the intuition. Is the player’s production consistent, clustering around a mean? Think of a reliable passer with 5-7 assists nightly. That’s Poisson-like, with predictable variance.
Or is it bursty with wild swings? Picture a volume shooter with 30 points one night and 8 the next. That’s the domain of the negative binomial, with higher variance and extreme outcomes. Your mental model should identify which pattern fits.
Opponent splits are key here. A tough defensive matchup doesn’t just lower the average—it changes the distribution’s shape. Variance might compress or expand, and extreme outcomes’ probability shifts.
Consider this comparison of statistical approaches:
| Statistical Approach | Best For | Key Insight | Example Use Case |
|---|---|---|---|
| Poisson Distribution | Consistent, low-variance stats | Models events with known average rate | Backup PG assist props vs weak perimeter defense |
| Negative Binomial | High-variance, bursty production | Accounts for over-dispersion; critical for opponent splits analysis | Volume scorer points props vs elite defensive teams |
| Normal Approximation | Large sample sizes only | Often misleading for discrete counts | Avoid for most player props |
| Custom Simulation | Complex multi-stat correlations | Like ShotQuality’s model—builds full outcome range | Parlay or SGP strategy development |
The shift from “Will he get 3 assists?” to “What’s the probability he gets 3 or more?” is everything. Binary thinking belongs to amateurs. Probabilistic thinking separates analysts.
Tools like the ShotQuality model simulate possible outcomes. They take inputs like minutes, usage, and pace to generate thousands of stat lines. The output is a probability curve, not a single number.
Your edge comes from understanding where the sportsbook’s distribution differs from reality. Maybe they underestimate the tail risk—the chance of a 10-rebound night from that backup center. Or perhaps they overestimate consistency against certain opponent splits.
This framework turns raw data into actionable insight. It’s the difference between guessing and calculating. Between hoping and knowing.
Blending Projections (Consensus + Manual Bumps)
Consensus projections are like fast food in sports analytics. They’re easy, but they don’t really help your bankroll. When RotoGrinders, Establish The Run, and Action Network all say the same thing, it’s just the same old data.
The real edge is in the differences between what models predict and what happens. This is where manual bumps make you more than just a data user. You become a market expert.
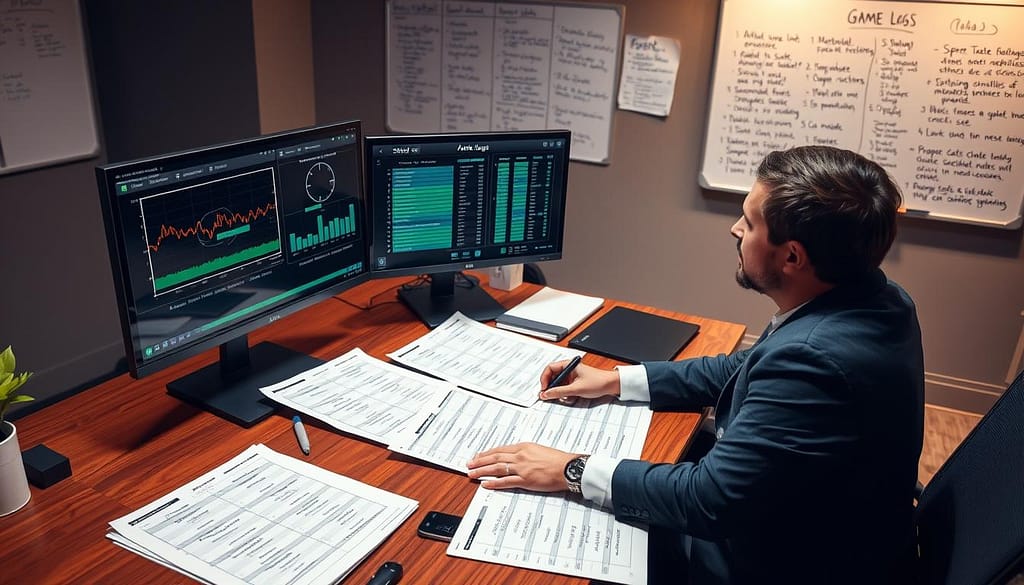
Think of projections as basic ingredients. Your research adds the flavor. Did the models consider the second game of a back-to-back? Does the game script match your coaching matchup analysis? Is the public betting too much on the over?
Start with the game logs. Season averages are nice, but recent games show the truth. Look for trends in role or efficiency that average data hides.
Minutes projections tell stories about coaching trust, matchup weaknesses, and managing fatigue. A player might play fewer minutes but have more opportunities against a team that forces turnovers.
Here’s a simple way to blend projections:
- Start with 2-3 credible projections
- Find the outlier and understand why it’s different
- Check recent game logs for role changes
- Make manual adjustments for context the models missed
- Compare your final number to the market price
You don’t need to create complex models. Use the consensus as your base. Your manual adjustments are the unique part.
Maybe Establish The Run’s projection is low because they’re overvaluing last season’s playoffs. Action Network might show too much public money on the over, making the under a better bet if your minutes projections account for a tough defense.
This approach makes you a chef, not just a waiter. Waiters serve what’s already made. Chefs taste, adjust, and create something unique. Your final projection should make you a little uneasy. If it looks just like everyone else’s, you haven’t done anything special.
The most powerful manual bump often comes from simple questions the algorithms can’t answer. Is this player in a contract year? Did the coach hint at a bigger role in yesterday’s press conference? Does the opponent have a weakness this player can exploit?
Blending is about curating, not averaging. You respect the data but override it when your research says so. Those game logs and adjusted minutes projections become your unique dish in a market full of microwave meals.
Late News Protocol (Q Tags, Back-to-Backs)
Creating a late-news protocol is not just about reacting. It’s about gaining an edge by being informed. In the prop market, being early is key, but knowing the right information is more important. Your protocol acts as a shield against unexpected news.
This isn’t just about scrolling through social media. It’s about gathering information with precision. You’re not just checking Twitter; you’re setting up a network that alerts you to big changes early.
Your sources of information need to be carefully chosen. Think of them as your own news feeds:
- Rotoworld & aggregated feeds: They offer a wide range of sports news. But timing is everything.
- Twitter lists of actual beat writers: Follow local reporters who break news, not just speculate.
- Weather websites for outdoor sports: Weather can greatly affect games, changing a pitcher’s strikeout from “maybe” to “must.”
- Team apps & official announcements: These are the most reliable sources. Sometimes, the truth is hidden in a coach’s words.
“Q” stands for Questionable, covering a wide range from minor issues to serious injuries. Your task is to figure out the severity.
Back-to-back games can be tough on players, leading to reduced minutes and effort. This slows down the game and changes scoring patterns.
Your protocol should be a checklist followed consistently. Check it at three key times:
- 60 minutes before lock: First sweep. Check who’s in or out and for any rotation news.
- 30 minutes before lock: Depth check. Has the Vegas total changed? This shows expected game pace changes.
- 10 minutes before lock: Final check. Confirm starting lineups and any last-minute changes.
This isn’t about being paranoid. It’s about being prepared. When news comes, you’re ready to act, not panic.
Remember, in the last hour before a game, information quickly loses value. Your protocol keeps it valuable.
Tools: logs databases, alerts, scratch models
Think of your prop betting toolkit as a surgeon’s tray: you need precision instruments, not butter knives. The right tools don’t just make the job easier—they make it possible. Let’s inventory the arsenal.
Your non-negotiable foundation is access to historical data. This isn’t about having more data, but the right data. Without it, you’re guessing.
Sports Reference sites (Basketball-Reference, etc.) are the free, powerful, and slightly clunky Library of Alexandria for sports data. This is where you mine deep historical game logs and analyze opponent splits.
Want to know how a point guard performs against top-10 defenses? Check the splits. Need to see a player’s trend over the last 20 games? The logs are there. It’s raw, unfiltered history.
The News Wire: Your Real-Time Monitor
Rotowire is your depth chart monitor and breaking news feed. Is a star player a late scratch? Is a backup suddenly getting first-team reps in practice? This is your early warning system.
In prop betting, news isn’t just information—it’s currency. Being five minutes late can mean the difference between a +120 line and a -150 line.
The Advanced Lab: Correlation and Sentiment
For the sophisticated operator, FantasyLabs offers tools that hint at public sentiment. Their correlation models and ownership projections can reveal where the “sharp” money might be flowing.
It’s like having a heat map of market movement. This isn’t essential for beginners, but it’s a force multiplier for veterans.
The Line Shoppers: Odds Comparators
You can have the best projection in the world, but if you bet it at -125 when it’s available at +105 elsewhere, you’ve already lost. For free, efficient line shopping, OddsTrader gets the job done.
DonBest is the professional-grade, real-time feed. It’s overkill for most, but essential for high-volume bettors who need millisecond updates. Think of it as the Bloomberg Terminal of sports betting.
The Alert System: Your Digital Sentinel
Set up alerts on your odds comparator and a news aggregator. Your phone should buzz for key injuries, lineup changes, and significant line movement. Discipline means not checking constantly—let the tools work for you.
A quiet phone is often a good sign. A flurry of alerts means the market is reacting to something you need to know.
The Scratch Model: Your Personal Blender
This can be as simple as an Excel or Google Sheets template. You input consensus projections, apply your manual bumps for matchup or rest, and calculate implied probability versus your probability.
The goal isn’t complexity. It’s clarity. A good scratch model answers one question: “Based on my analysis, is this line value or trash?”
| Tool | Primary Function | Best For | Cost |
|---|---|---|---|
| Sports Reference | Historical game logs & opponent splits | Foundational research | Free |
| Rotowire | Real-time news & depth charts | Late-breaking information | Premium |
| FantasyLabs | Correlation tools & ownership data | Advanced market analysis | Premium |
| OddsTrader | Line shopping across books | Finding the best price | Free |
| DonBest | Professional odds feeds | High-volume trading | Enterprise |
| Excel/Sheets | Custom projection modeling | Synthesizing all data | Free |
The table above isn’t a shopping list. You don’t need every tool. You need the right combination for your style.
A recreational bettor might thrive with just Sports Reference and OddsTrader. A serious weekly player adds Rotowire and a basic spreadsheet. The professional uses them all in concert.
The common mistake is tool fetishism—collecting apps like Pokémon cards without integrating them into a workflow. Your tools should talk to each other. Your database informs your model, your alerts trigger model updates, and your line shopper finds the best price for your edge.
Remember: a scalpel in a sculptor’s hand is just a sharp piece of metal. In a surgeon’s hand, it saves lives. Your tools are only as good as your understanding of how to use them together.
Correlations & SGP/Alt‑Line Strategies (Risk Notes)
Betting on individual props is like playing checkers. But understanding correlations is like moving to three-dimensional chess. You’re no longer just looking at numbers. You’re seeing how a point guard’s assists affect his teammates’ shots.
FantasyLabs is your secret decoder ring. It helps you see how different players are connected. For example, betting on Nikola Jokić’s assists is also a bet on his teammates’ shots.

Two advanced strategies are Same Game Parlays (SGPs) and Alternate Lines. They’re tempting but come with risks.
SGPs are not just random bets. They’re focused on a specific story. Betting on LeBron James, Anthony Davis, and the Lakers winning is a bet on dominance. But the math can be tough.
Sportsbooks make a lot of money from these bets. Each leg might seem fair, but together, the odds are stacked against you. The edge you find in each prop disappears when combined.
Alternate lines test your minutes projections skills. Sportsbooks offer different odds for LeBron James’ points. But is the higher bet realistic?
Does LeBron’s points likely reach 25+? Or is that an extreme case? Your answer depends on his role, pace, and minutes. A drop in minutes projections can make the higher bet a bad choice.
Here’s a simple way to check these bets:
- The SGP Test: Does your parlay need a very specific game script to win? If yes, the hold might be too high.
- The Alt-Line Litmus Test: Does the higher bet fit within the player’s likely range? Or is it too high?
- The Single vs. Parlay Rule: Sometimes, taking separate bets is smarter. You get the benefits without the high risk.
Think of it as risk geometry. Parlays are narrow and risky. Singles are focused. A mix of singles is safer. Choose what fits your bankroll and confidence.
The big parlay payout is tempting. But taking the single bet is often smarter. It’s what separates the winners from the losers.
Your minutes projections are key. Correlations help build on them. But remember, a strong foundation is essential. Don’t bet on shaky ground.
EV logging and pass discipline
Passing on a bet can be more profitable than winning one. But you’ll never know unless you track both with discipline. This isn’t about being a scorekeeper—it’s about being a forensic accountant of your own betting habits.
Without EV logging, you’re flying blind. You might mistake luck for skill and variance for edge.
EV logging means recording the full autopsy of every decision. Not just “won” or “lost,” but the odds, your calculated probability, and the resulting edge. Think of it as your betting report card. Are you actually beating the closing line? Or are you just celebrating random noise?
A simple Google Sheet or Excel workbook is your laboratory. Create columns for date, player, market, odds, your probability, calculated edge, and result. The magic happens in the review. That prop you passed because the pace projection was shaky? Log it. The over you took based on juicy opponent splits? Document the reasoning.
Your pass log is often more valuable than your bet log. Why did you skip that tempting line? Was it a minutes concern, a nagging injury, or a scheme mismatch? Tracking passes forces discipline. It turns “gut feels” into data points. Suddenly, you’re not avoiding bets—you’re collecting evidence for future decisions.
Tools like Action Network’s bet tracker or Pikkit can automate the grunt work. But the analysis—that’s on you. This is where you audit your manual bumps. Did your adjustment for a team’s pace actually add value? Or did it just make you feel smarter?
| What to Track | Basic Method | Advanced Method | Key Insight |
|---|---|---|---|
| Bet Result (Win/Loss) | Checkmark in an app | EV calculation: (Probability * Odds) – 1 | A win can be -EV; a loss can be +EV |
| Passed Opportunities | Mental note, forgotten by tip-off | Log with reason: “Pace too slow,” “Splits misleading” | Your discipline ROI is invisible without this |
| Market Movement | Not tracked | Compare your line to closing line | Beating closing line = true edge indicator |
| Bankroll Impact | “Up” or “Down” feeling | Kelly Criterion sizing based on edge % | Proper sizing maximizes long-term growth |
| Adjustment Analysis | “Felt right” | Track performance of manual bumps for pace/splits | Reveals which insights are actually predictive |
Bankroll calculators, like the Kelly Criterion, transform this data into action. Kelly tells you how much to bet based on your edge. It’s the difference between betting like a rational investor and betting like a kid at a carnival ring-toss. No more flat betting everything. Your bankroll grows geometrically when your stake matches your conviction.
Let’s be blunt: if you’re not doing this, you’re donating. The sportsbooks have their logs, their models, their risk teams. You’re bringing a water pistol to a data war. EV logging turns anecdotes into evidence. It shows whether your love for certain opponent splits is a profitable strategy or a costly bias.
The review session is where you become a historian instead of a storyteller. Look at your log weekly. Which pace adjustments worked? Which player scenarios should you avoid? This feedback loop is everything. It’s how you evolve from a bettor who gets lucky to an analyst who creates luck.
Discipline isn’t sexy. Logging passes won’t get you high-fives at the bar. But it will keep your bankroll intact while others chase losses. In the long run, the most profitable line in your spreadsheet might be the one marked “PASS.”
Three Live Examples (Bet/Pass with Reasoning)
Let’s dive into three real betting examples. Think of this as a final rehearsal before the big show. Each scenario uses our full toolkit, showing when to bet and when to hold back.
Being a good prop bettor isn’t just luck. It’s about systematic reasoning. Let me share three real decisions I made last season.
Let’s call the player “The Board Man.” The bet was over 8.5 rebounds at -110. First, I check the game logs. I look at his season average and specific matchup history.
Against this opponent, he averaged 11 rebounds in their last six games. The pace was expected to be high, with +5 possessions above average. Then, news came that their starting center was out with knee soreness.
Projections had him at 9.2 rebounds. But, situational splits bumped him to 9.8. The chance of him getting 9+ rebounds was 62%. The edge was 4%.
Verdict: BET. The math was clear.
Example 2: The PASS – Assists Over 6.5
“The Floor General” was the player. The bet was over 6.5 assists at -115. It looked good on paper, with 34 minutes expected and high usage.
But the game logs showed a different story. This opponent was great at forcing turnovers and limiting assists. Their defense trapped ball handlers far from the basket. My analysis showed a high chance of 5 or 6 assists.
The chance of 7+ assists was only 30%. The line was fair. No edge, just wishful thinking after his last triple-double.
Verdict: PASS. Sometimes, the best bet is not making one.
Example 3: The BET – Points Under 22.5
“The Volume Scorer” was the player. The bet was under 22.5 points at +100. This was a contrarian spot, with the public betting on the over after his big game.
They missed something important. This was a late-night, second game of a back-to-back on the road. Historical splits showed a 15% drop in scoring efficiency in this scenario. The opponent’s defender had a 4-inch height advantage and had held him to 18 points before.
The game logs showed a pattern. In back-to-back road games, his shot attempts and three-point percentage dropped. My adjusted projection was 20.5 points. The edge was 3.5%.
Verdict: BET the under. The market was overpricing his last game.
See the pattern? It’s not just one data point. It’s the convergence of minutes, matchup, scheme, and situation. Like a detective, each clue builds the case until it’s clear.
The public bets on stories. We bet on probabilities. That’s the only edge that lasts.
Props checklist for pre‑lock
Think of this as your cockpit before takeoff. Every switch, every gauge needs a glance. Your props research toolkit isn’t magic. It’s method.
Start with the market. Is the line fresh or sitting there like yesterday’s news? Did it jump three points on whispers you missed? Your minutes projections are the engine. If they’re based on outdated injury reports or ignore a coach’s new rotation, you’re flying blind. Pace matters more than reputation. A slow team can make a speedster look ordinary.
This systematic approach isn’t just for sports. Any complex project needs a list. It’s like the prop shop manager’s bible for a Broadway show. Every item, from rehearsal props to the final strike, gets logged. Your bet is your production.
Check your distribution intuition. Are you betting the likely average or praying for a statistical outlier? Blend the consensus numbers with your own reasoned bumps. Your final number should tell a story the market hasn’t read yet.
Then scan for late news. Beat writer Twitter feeds are your radar. A surprise “Q” tag can ground your whole thesis. Shop your lines. An extra half-point is fuel for your bankroll.
Ask the hard question. Is this a value bet or an action bet? The edge isn’t a feeling. It’s a calculation. This checklist turns noise into signal. It transforms a guess into a reasoned play. Now you’re not just betting. You’re executing.